flowchart TD
    A[世界银行 API] --> B[数据采集<br/>download_data.py]
    B --> C[数据处理<br/>国家映射、指标计算]
    C --> D[数据存储<br/>CSV 文件]

    D --> E[Streamlit 应用<br/>app.py]
    E --> F[DuckDB<br/>内存 SQL]

    F --> G[可视化引擎<br/>Plotly Express]
    F --> H[AI 查询引擎<br/>ModelScope API]
    F --> I[会话管理<br/>用户状态]

    G --> J[交互式图表]
    H --> K[自然语言<br/>转 SQL]
    I --> L[持久化<br/>查询结果]

    J --> M[用户界面]
    K --> M
    L --> M
使用 AI SQL 构建的交互式 GDP 趋势看板
Data Visualization
Streamlit
Economic Analysis
AI
项目概览
GDP 趋势看板 (GDP Trend Dashboard) 是一个复杂的 Web 应用程序,用于可视化和分析来自世界银行 API 的经济数据。该系统的独特之处在于其双重方法:将传统的交互式可视化与 AI 驱动的自然语言查询相结合,使技术分析师和普通用户都能轻松获取经济数据。
在线演示:https://world-GDP-trend.streamlit.app
Github:https://github.com/JCwinning/GDP_trend
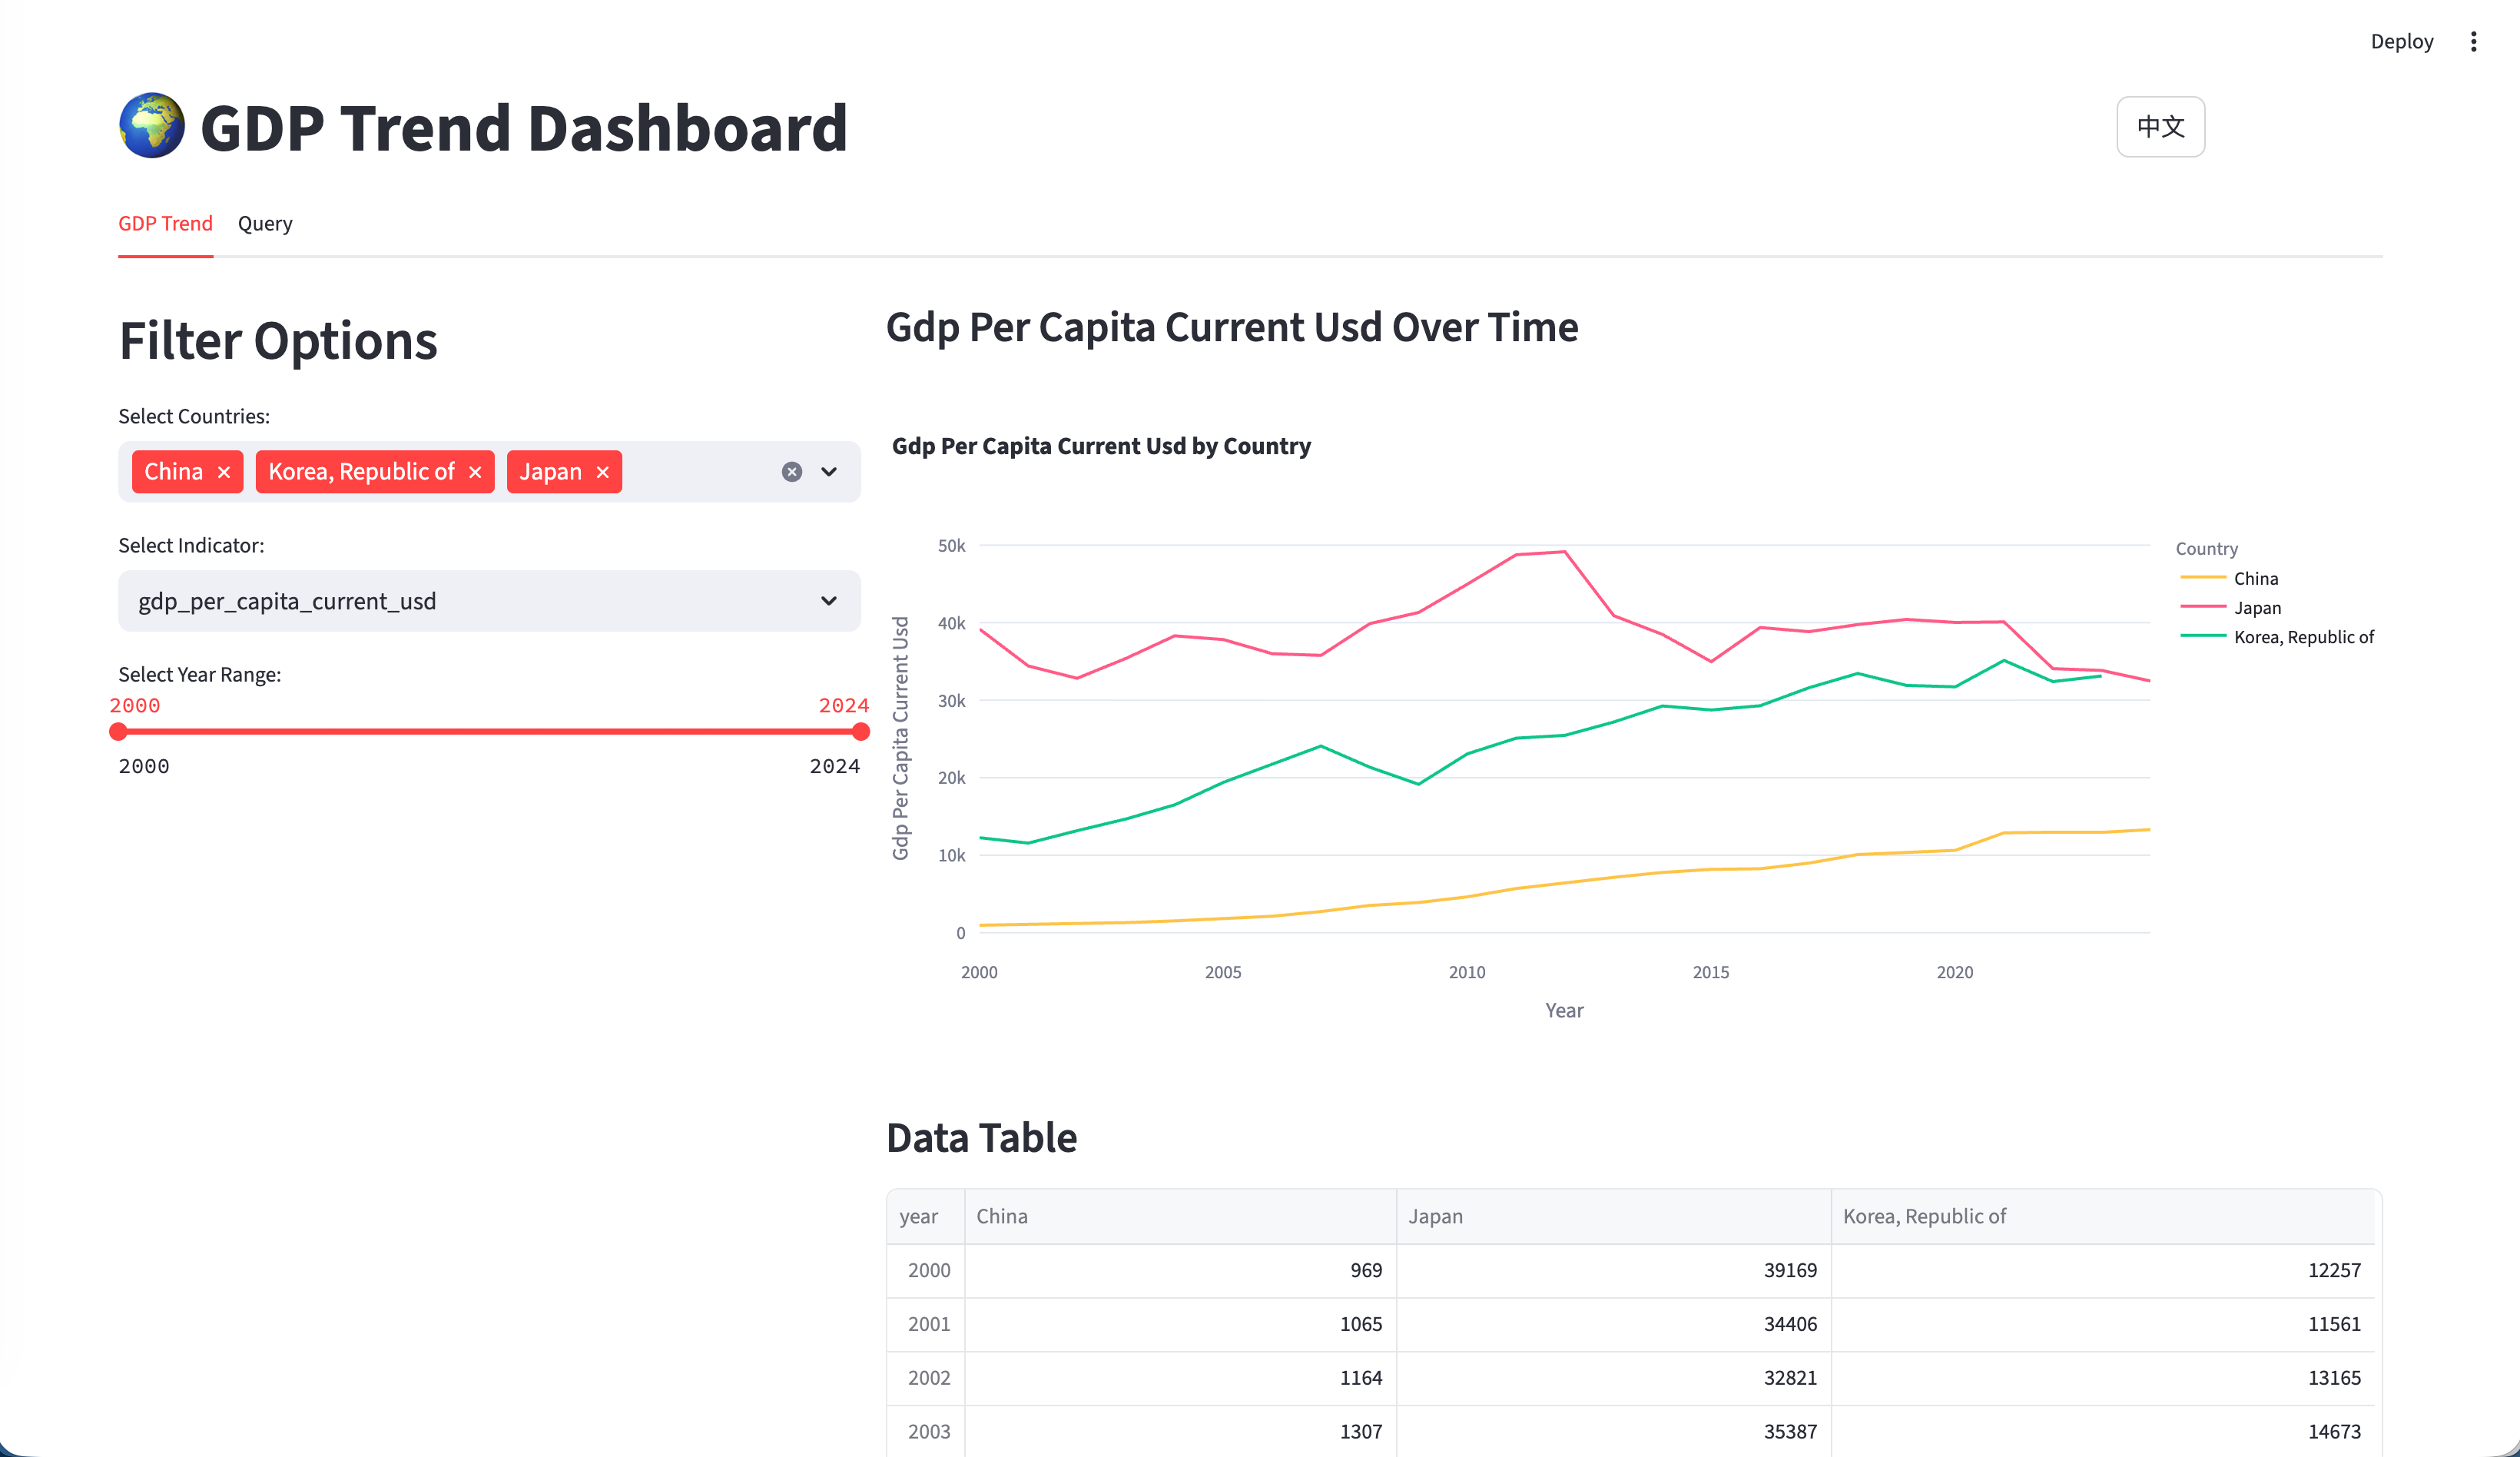
交互式全球 GDP 趋势可视化
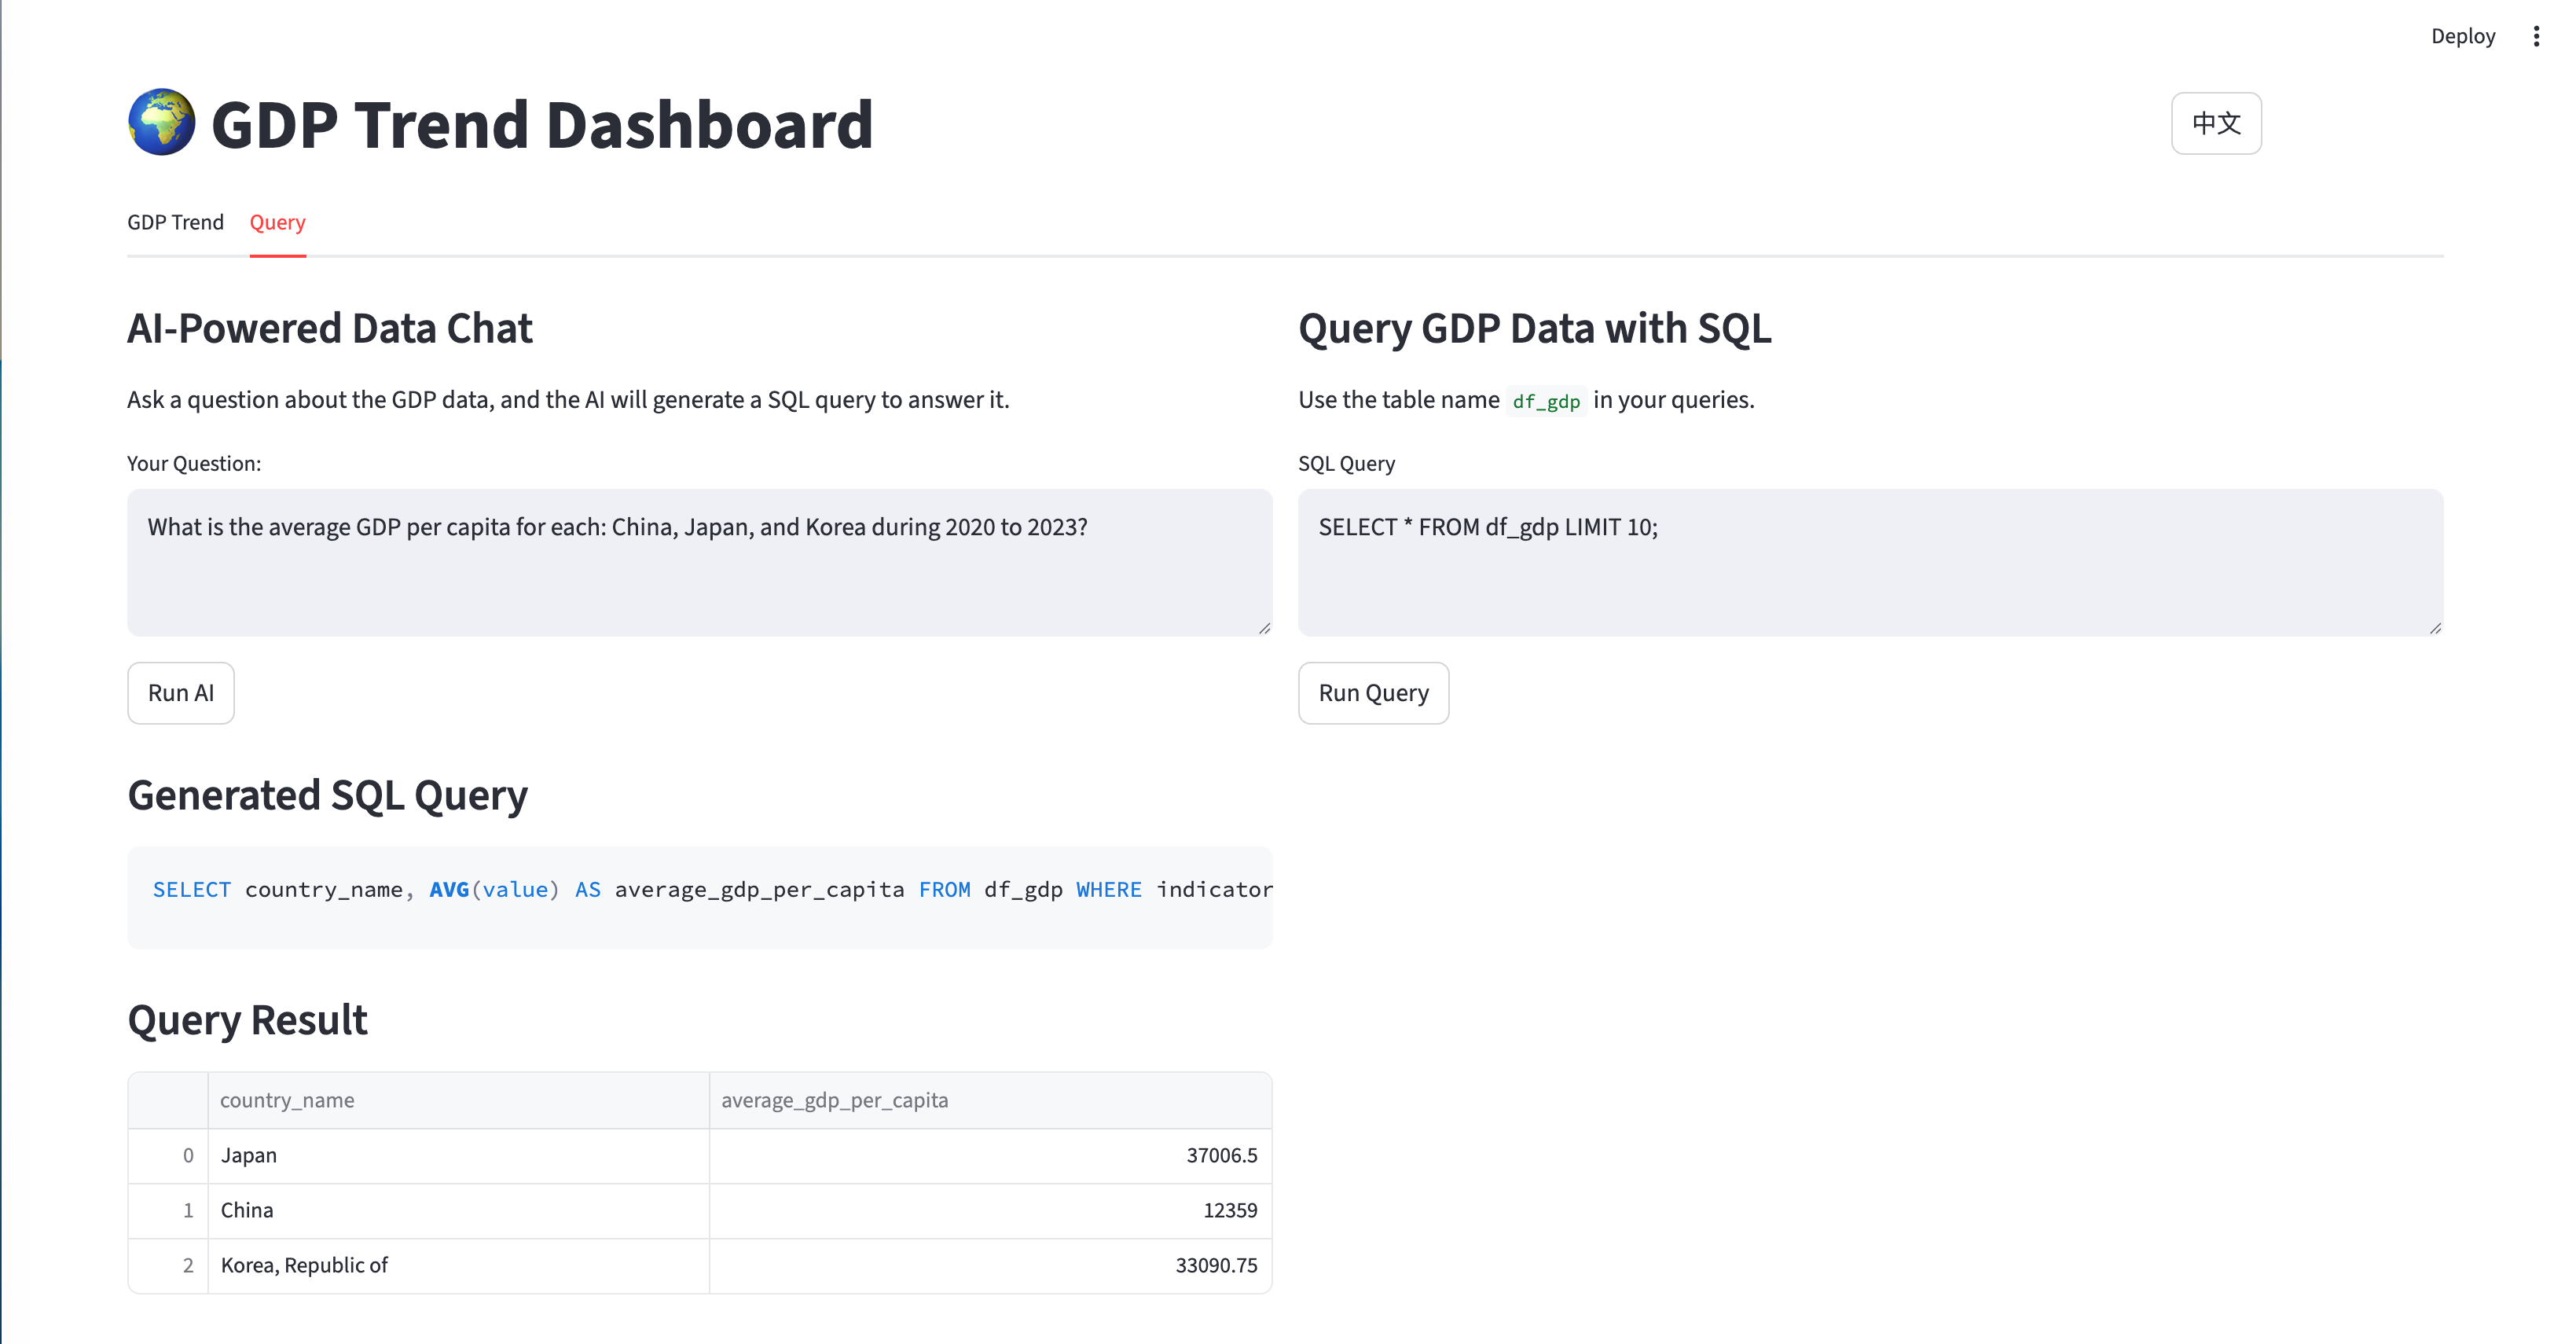
交互式 AI 驱动的自然语言转 SQL
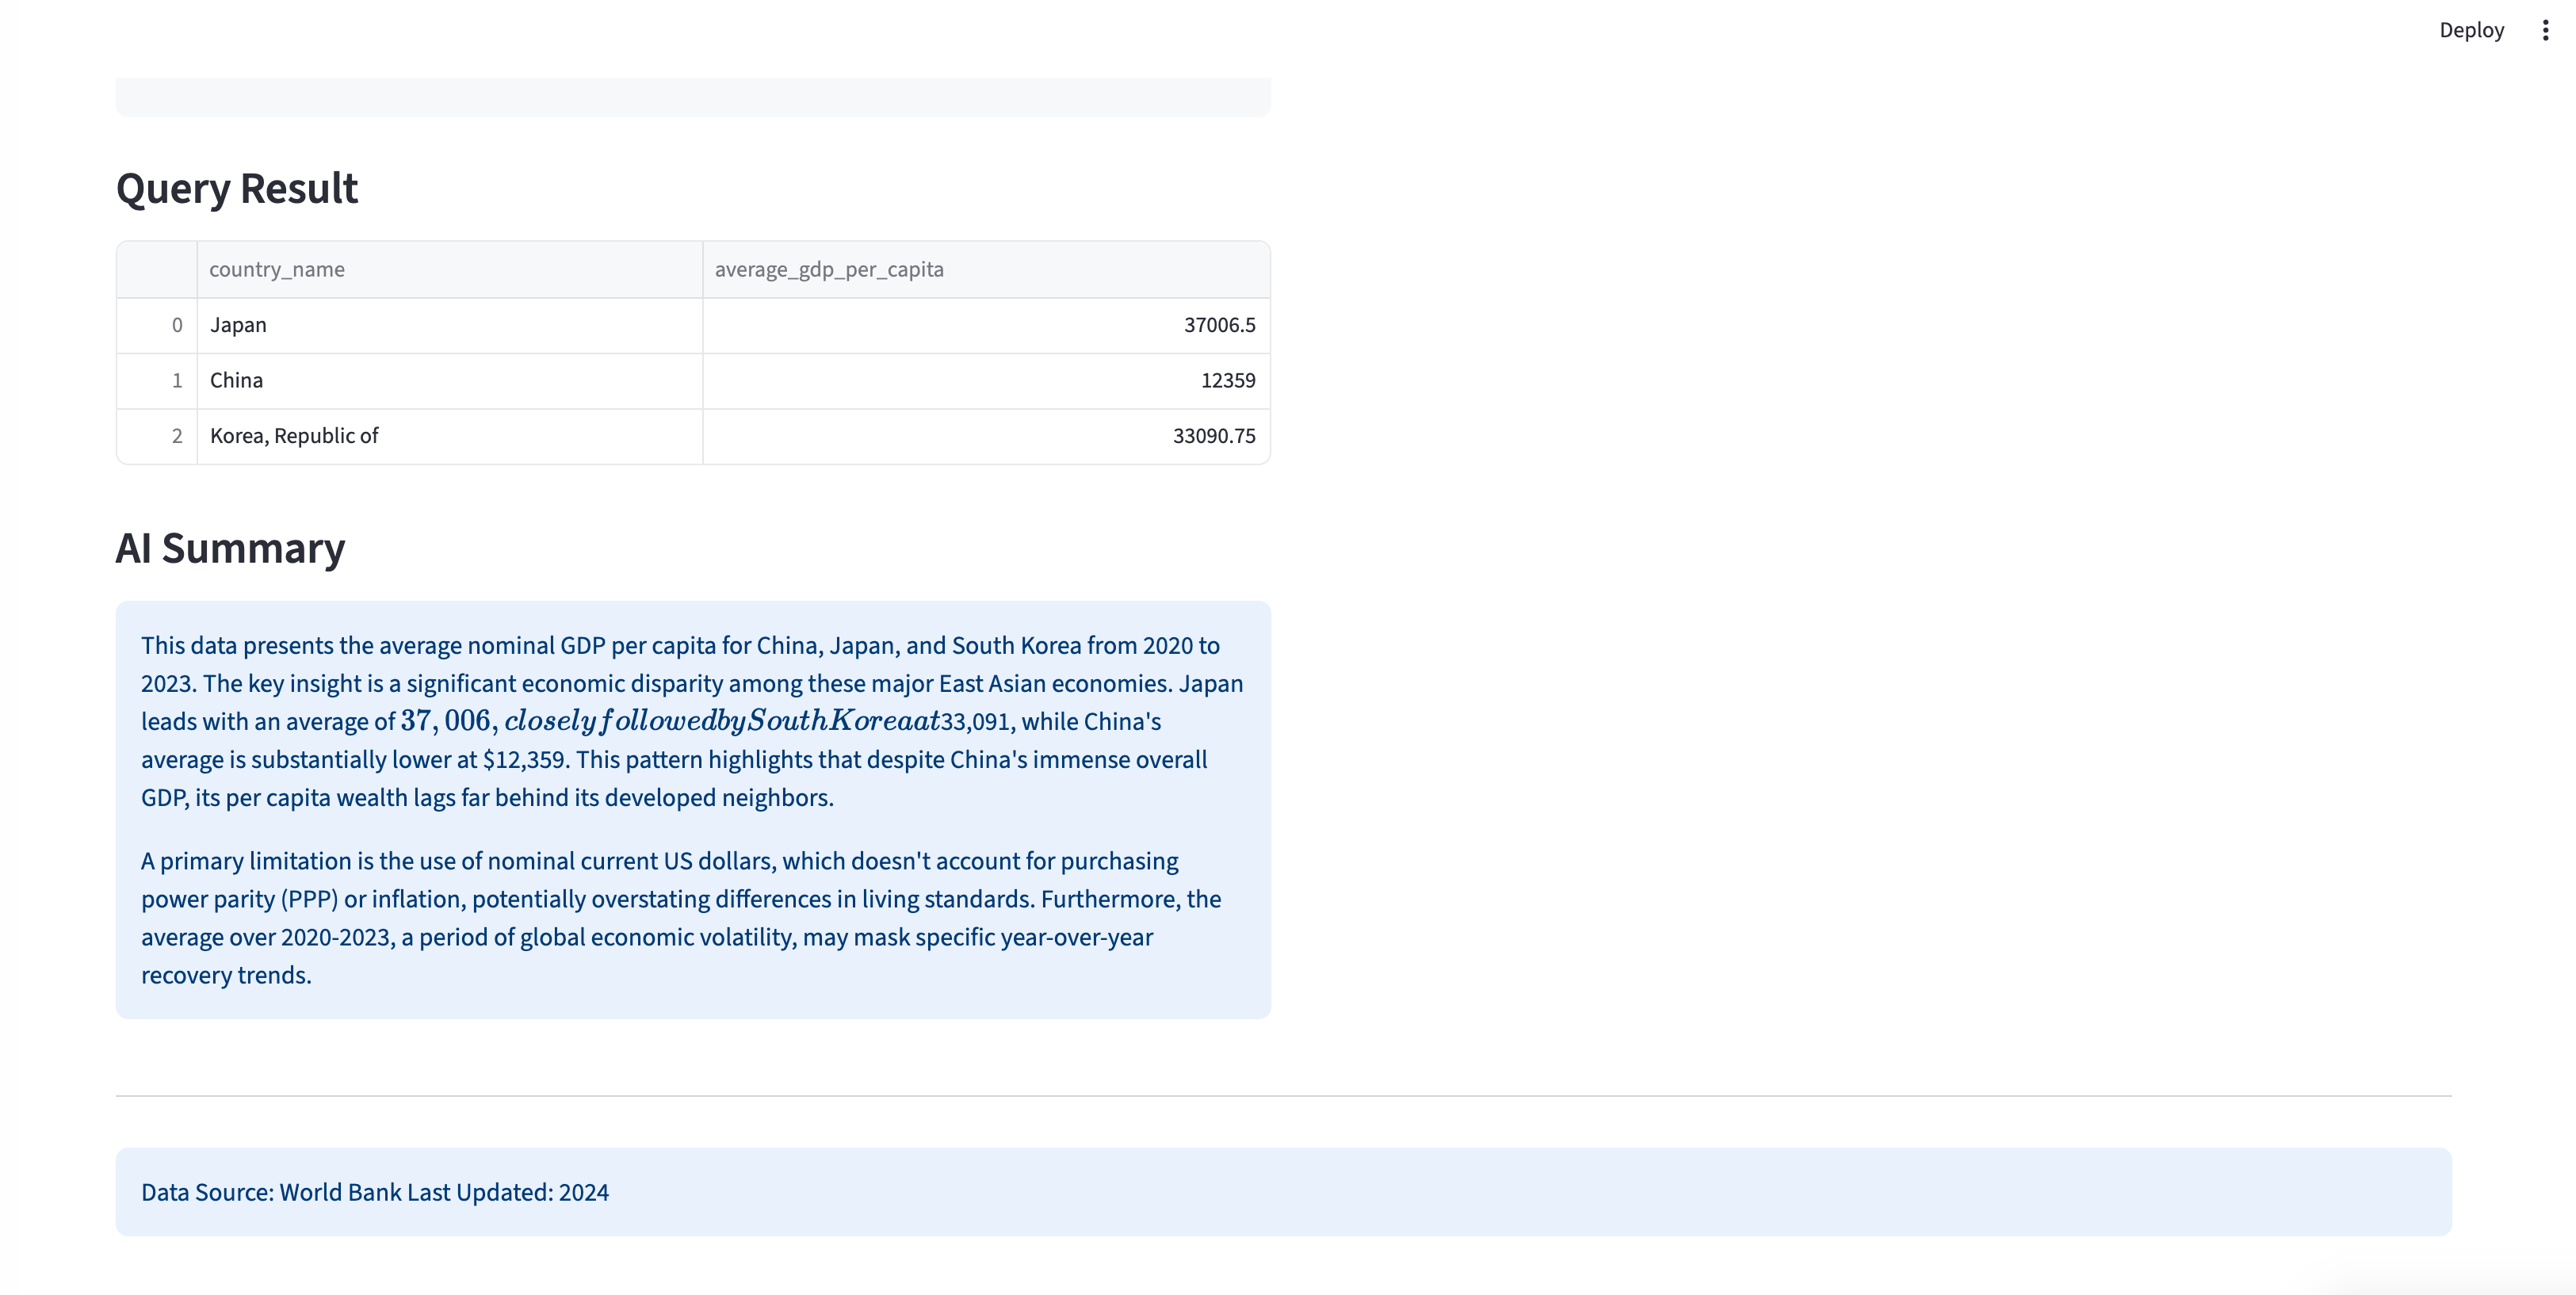
AI 生成的经济数据洞见摘要
核心架构
技术栈
- 主要框架:用于交互式 Web 应用的 Streamlit
- 数据处理:用于数据操作和分析的 Pandas
- 可视化:用于交互式图表的 Plotly Express
- 数据库:用于高效 SQL 查询的 DuckDB
- AI 集成:用于自然语言转 SQL 的 ModelScope GLM-4.6
- 数据源:通过
wbgapi库调用的世界银行 API
关键特性
- 多国 GDP 趋势对比
- 支持多种经济指标(GDP、人均 GDP、人口、同比增长率)
- AI 驱动的自然语言查询
- 使用 DuckDB 的直接 SQL 接口
- 完善的双语支持(中/英文)
- 带交互控制的时间范围筛选(2000年至今)
数据流水线架构
该应用程序实现了一个复杂的数据流水线,以确保数据质量和实时可用性:
数据采集与处理
世界银行 API 集成
应用程序使用世界银行 API 采集全面的经济数据:
Code
import wbgapi as wb
import pycountry
import pandas as pd

def download_economic_data():
    """从世界银行 API 下载所有国家的 GDP 数据"""

    # 定义要下载的经济指标
    indicators = {
        'gdp_current_usd': 'NY.GDP.MKTP.CD',
        'gdp_per_capita_current_usd': 'NY.GDP.PCAP.CD',
        'population_total': 'SP.POP.TOTL'
    }

    # 下载 2000 年至今的数据
    data_frames = []
    for indicator_name, indicator_code in indicators.items():
        df = wb.get_series(
            series=indicator_code,
            economy='all',
            time='2000:2024',
            simplify_index=True
        )

        # 处理并添加到集合
        df = df.reset_index()
        df['indicator'] = indicator_name
        data_frames.append(df)

    # 合并所有指标
    combined_df = pd.concat(data_frames, ignore_index=True)
    return combined_df

def create_country_reference_table():
    """创建包含 ISO 代码的完整国家元数据表"""
    countries = list(pycountry.countries)

    df_all = pd.DataFrame([{
        'country_name': country.name,
        'country_code_2': country.alpha_2,
        'country_code_3': country.alpha_3
    } for country in countries])

    # 添加大洲映射
    iso_to_continent = {
        "US": "North America", "CN": "Asia", "JP": "Asia",
        "DE": "Europe", "GB": "Europe", "FR": "Europe"
        # ... 为所有国家完成映射
    }

    df_all['continent'] = df_all['country_code_2'].map(iso_to_continent)
    return df_all
数据模式与结构
应用程序使用清晰、规范化的数据结构:
Code
-- 主要数据模式
CREATE TABLE df_gdp (
    country_name TEXT,        -- 显示名称 (英文)
    country_code_2 TEXT,      -- ISO alpha-2 代码
    country_code_3 TEXT,      -- ISO alpha-3 代码
    continent TEXT,            -- 大洲分类
    year INTEGER,              -- 数据年份
    indicator TEXT,            -- 经济指标名称
    value REAL                -- 指标数值
);

-- 示例数据
INSERT INTO df_gdp VALUES
('United States', 'US', 'USA', 'North America', 2023, 'gdp_current_usd', 27444144.3),
('United States', 'US', 'USA', 'North America', 2023, 'gdp_per_capita_current_usd', 81254.2),
('United States', 'US', 'USA', 'North America', 2023, 'population_total', 334914895.0);
交互式可视化系统
Plotly Express 实现
应用程序使用 Plotly Express 创建交互式图表,并保持一致的颜色编码:
Code
import plotly.express as px

@st.cache_data
def load_data():
    """加载并缓存 GDP 数据"""
    return pd.read_csv('data/gdp_data_2000_present.csv')

def create_gdp_trend_chart(selected_countries, selected_indicator, year_range):
    """创建交互式 GDP 趋势可视化"""

    # 加载筛选后的数据
    df = load_data()

    # 应用筛选条件
    filtered_df = df[
        (df['country_name'].isin(selected_countries)) &
        (df['indicator'] == selected_indicator) &
        (df['year'].between(year_range[0], year_range[1]))
    ]

    # 创建交互式折线图
    fig = px.line(
        filtered_df,
        x='year',
        y='value',
        color='country_name',
        title=f'{selected_indicator.replace("_", " ").title()} 趋势',
        labels={
            'year': '年份',
            'value': format_indicator_label(selected_indicator),
            'country_name': '国家'
        }
    )

    # 自定义图表外观
    fig.update_layout(
        xaxis_title="年份",
        yaxis_title=format_indicator_label(selected_indicator),
        hovermode='x unified',
        showlegend=True,
        legend=dict(
            orientation="h",
            yanchor="bottom",
            y=1.02,
            xanchor="right",
            x=1
        )
    )

    return fig

def format_indicator_label(indicator):
    """格式化指标名称以供显示"""
    labels = {
        'gdp_current_usd': 'GDP (现价美元)',
        'gdp_per_capita_current_usd': '人均 GDP (现价美元)',
        'population_total': '总人口',
        'gdp_per_capita_current_usd_yoy': '人均 GDP 同比增长率 (%)'
    }
    return labels.get(indicator, indicator.replace('_', ' ').title())
AI 驱动的分析
自然语言转 SQL
该程序最具创新性的功能是 AI 驱动的自然语言查询:
Code
from openai import OpenAI
import duckdb

def generate_sql_from_question(question, language):
    """使用 ModelScope API 将自然语言问题转换为 SQL 查询"""

    # 获取数据库模式上下文
    schema_info = """
    表名: df_gdp
    列名:
    - country_name (TEXT): 国家显示名称
    - country_code_2 (TEXT): ISO alpha-2 国家代码
    - continent (TEXT): 大洲分类
    - year (INTEGER): 数据年份 (2000-2024)
    - indicator (TEXT): 经济指标名称
    - value (REAL): 指标数值

    可用指标:
    - gdp_current_usd: 现价 GDP (美元)
    - gdp_per_capita_current_usd: 现价人均 GDP (美元)
    - population_total: 总人口
    - gdp_per_capita_current_usd_yoy: 人均 GDP 同比增长率 (%)
    """

    # 创建特定语言的提示词
    if language == "zh":
        prompt = f"""请将以下自然语言问题转换为SQL查询,仅返回SQL语句,不要解释。

数据库信息:
{schema_info}

用户问题:{question}

要求:
1. 只返回标准的SELECT语句
2. 不要添加任何解释或注释
3. 使用LIMIT 50限制结果数量"""
    else:
        # (保持原英文 prompt)
        prompt = f"""Convert the following natural language question to SQL query. Return only the SQL statement, no explanation.

Database information:
{schema_info}

User question: {question}

Requirements:
1. Return only standard SELECT statement
2. Do not add any explanation or comments
3. Use LIMIT 50 to restrict results"""

    # 调用 ModelScope API
    client = OpenAI(
        api_key=os.getenv('MODELSCOPE_API_KEY'),
        base_url="https://dashscope.aliyuncs.com/compatible-mode/v1"
    )

    response = client.chat.completions.create(
        model="qwen/Qwen3-235B",
        messages=[{"role": "user", "content": prompt}],
        temperature=0.1,  # 使用低温度以获得一致的 SQL
        max_tokens=500
    )

    return response.choices[0].message.content.strip()
查询执行与 AI 摘要
Code
def execute_query_with_ai_summary(sql_query, original_question):
    """执行 SQL 查询并生成 AI 摘要"""

    try:
        # 使用 DuckDB 执行查询
        conn = duckdb.connect()
        result_df = conn.execute(sql_query).fetchdf()

        # 将结果存入会话状态
        st.session_state.sql_result = result_df
        st.session_state.sql_query = sql_query

        # 如果有数据,生成 AI 摘要
        if not result_df.empty:
            generate_ai_summary(result_df, original_question)

        return result_df

    except Exception as e:
        st.error(f"查询执行错误: {str(e)}")
        return None

def generate_ai_summary(data_frame, question):
    """生成查询结果的 AI 摘要"""

    # 将 DataFrame 转换为文本以便分析
    data_summary = data_frame.to_string(index=False)

    summary_prompt = f"""根据以下数据分析结果,提供一个简明扼要的摘要:

原始问题:{question}

查询结果:
{data_summary}

请提供:
1. 关键发现的简要分析
2. 任何值得注意的趋势或模式
3. 来自数据的重要见解

请将摘要控制在 200 字以内,并确保通俗易懂。"""

    # 使用 AI 生成摘要
    client = OpenAI(
        api_key=os.getenv('MODELSCOPE_API_KEY'),
        base_url="https://dashscope.aliyuncs.com/compatible-mode/v1"
    )

    response = client.chat.completions.create(
        model="qwen/Qwen3-235B",
        messages=[{"role": "user", "content": summary_prompt}],
        temperature=0.3,
        max_tokens=300
    )

    st.session_state.ai_summary = response.choices[0].message.content
双语支持系统
国际化架构
应用程序实现了全面的中/英文支持:
Code
# language.py - 完整的翻译系统
translations = {
    "en": {
        "title": "🌍 GDP Trend Dashboard",
        "gdp_trend": "GDP Trend",
        "ai_powered_chat": "AI-Powered Data Chat",
        "default_question": "What is the average GDP per capita for China, Japan, and Korea during 2020 to 2023?"
    },
    "zh": {
        "title": "🌍 GDP 趋势看板",
        "gdp_trend": "GDP 趋势",
        "ai_powered_chat": "AI 数据对话",
        "default_question": "2020年至2023年期间,中国、日本和韩国的平均人均GDP是多少?"
    }
}

def get_text(key):
    """获取当前语言的翻译文本"""
    language = st.session_state.get("language", "en")
    return translations.get(language, {}).get(key, key)

# UI 中的语言切换
col1, col2 = st.columns([1, 1])
with col1:
    if st.button("English"):
        st.session_state.language = "en"
        st.rerun()
with col2:
    if st.button("中文"):
        st.session_state.language = "zh"
        st.rerun()
用户界面设计
主应用程序结构
Code
def main():
    """采用标签页导航的主应用程序"""

    # 右上角的语言切换
    with st.container():
        st.markdown("""
        <div class="language-toggle">
            <button onclick="setLanguage('en')">EN</button>
            <button onclick="setLanguage('zh')">中文</button>
        </div>
        """, unsafe_allow_html=True)

    st.title(get_text("title"))

    # 标签页界面
    tab1, tab2 = st.tabs([get_text("gdp_trend"), get_text("query")])

    with tab1:
        render_gdp_trends_tab()

    with tab2:
        render_query_interface_tab()

def render_gdp_trends_tab():
    """渲染 GDP 趋势可视化标签页"""

    st.header(get_text("gdp_trend"))

    # 加载数据
    df = load_data()

    # 筛选控制
    col1, col2, col3 = st.columns([2, 1, 1])

    with col1:
        selected_countries = st.multiselect(
            get_text("select_countries"),
            options=df['country_name'].unique(),
            default=['United States', 'China', 'Japan']
        )

    with col2:
        selected_indicator = st.selectbox(
            get_text("select_indicator"),
            options=[
                'gdp_current_usd',
                'gdp_per_capita_current_usd',
                'population_total',
                'gdp_per_capita_current_usd_yoy'
            ],
            format_func=lambda x: format_indicator_label(x)
        )

    with col3:
        year_range = st.slider(
            get_text("select_year_range"),
            min_value=2000,
            max_value=2024,
            value=(2010, 2024),
            step=1
        )

    # 生成并显示图表
    if selected_countries and selected_indicator:
        fig = create_gdp_trend_chart(selected_countries, selected_indicator, year_range)
        st.plotly_chart(fig, use_container_width=True)

        # 显示原始数据选项
        if st.checkbox(get_text("show_raw_data")):
            display_filtered_data_table(selected_countries, selected_indicator, year_range)

def render_query_interface_tab():
    """渲染 AI 驱动的查询界面标签页"""

    st.header(get_text("ai_powered_chat"))
    st.markdown(get_text("ai_chat_description"))

    # 自然语言输入
    user_question = st.text_input(
        get_text("your_question"),
        value=st.session_state.get("user_question", get_text("default_question"))
    )

    col1, col2 = st.columns([1, 1])

    with col1:
        if st.button(get_text("run_ai"), type="primary"):
            if user_question:
                with st.spinner("AI 正在处理..."):
                    # 从自然语言生成 SQL
                    sql_query = generate_sql_from_question(
                        user_question,
                        st.session_state.language
                    )

                    if sql_query:
                        # 执行查询并生成摘要
                        result_df = execute_query_with_ai_summary(sql_query, user_question)

                        st.session_state.user_question = user_question
                        st.session_state.should_generate_ai_summary = True

    # 显示结果
    if st.session_state.get("sql_result") is not None:
        display_query_results()
性能优化
数据缓存与效率
Code
# Streamlit 数据操作缓存
@st.cache_data(ttl=3600)  # 缓存 1 小时
def load_data():
    """加载并缓存 GDP 数据"""
    return pd.read_csv('data/gdp_data_2000_present.csv')

@st.cache_data(ttl=1800)  # 缓存 30 分钟
def get_country_list():
    """获取并缓存唯一的国家列表"""
    df = load_data()
    return sorted(df['country_name'].unique())

# AI 交互的会话状态管理
def init_session_state():
    """初始化所有会话状态变量"""
    if "sql_result" not in st.session_state:
        st.session_state.sql_result = None
    if "ai_summary" not in st.session_state:
        st.session_state.ai_summary = None
    if "should_generate_ai_summary" not in st.session_state:
        st.session_state.should_generate_ai_summary = False
错误处理与用户体验
Code
def safe_api_call(func, *args, **kwargs):
    """带错误处理的安全 API 调用"""
    try:
        return func(*args, **kwargs)
    except Exception as e:
        st.error(f"API 错误: {str(e)}")
        return None

def validate_sql_query(sql_query):
    """基础 SQL 查询验证"""
    sql_lower = sql_query.lower().strip()

    # 基础安全检查
    dangerous_keywords = ['drop', 'delete', 'update', 'insert', 'alter']
    for keyword in dangerous_keywords:
        if keyword in sql_lower:
            raise ValueError(f"检测到危险 SQL 关键字: {keyword}")

    # 确保查询以 SELECT 开头
    if not sql_lower.startswith('select'):
        raise ValueError("仅允许执行 SELECT 查询")

    return True
部署与可访问性
环境配置
# 环境配置
# .env 文件
MODELSCOPE_API_KEY=your_modelscope_key

# 安装依赖
pip install -r requirements.txt

# 数据采集
python download_data.py

# 运行应用程序
streamlit run app.py
必需的依赖项
streamlit>=1.28.0
pandas>=1.5.0
plotly>=5.15.0
duckdb>=0.8.0
openai>=1.0.0
python-dotenv>=1.0.0
wbgapi>=1.0.0
pycountry>=22.0.0
numpy>=1.24.0
技术亮点
关键创新点
- 双界面方案:同时提供视觉和自然语言访问数据的方式
- AI 驱动的 SQL 生成:使用简单的中/英文即可进行复杂的经济查询
- 实时数据处理:高效的缓存和会话管理
- 全面的国际化:真正的双语支持及本地化数据显示
- 生产就绪的部署:完善的错误处理和性能优化
经济分析示例
支持的查询类型
- 对比分析
- “对比 2010 年至 2020 年中国和日本的 GDP 增长”
- “2023 年哪些国家的人均 GDP 最高?”
- 时序分析
- “显示过去十年金砖国家的 GDP 趋势”
- “2000 年至 2020 年印度的人口增长率是多少?”
- 统计查询
- “计算欧洲国家的平均 GDP 增长率”
- “找出 2022 年人均 GDP 超过 50,000 美元的国家”
- 复杂多变量分析
- “亚洲国家的人口与 GDP 之间有什么相关性?”
- “列出连续 3 年人均 GDP 增长超过 5% 的国家”
结论
这个 GDP 趋势看板代表了经济数据分析的创新方法,将传统的视觉化技术与尖端的 AI 能力相结合。该项目展示了:
- 先进的数据集成:集成世界银行 API 与全面的经济指标
- 自然语言处理:AI 驱动的 SQL 生成,实现便捷的数据查询
- 专业的视觉化:采用一致设计的交互式 Plotly 图表
- 双语支持:完整的英/中本地化
- 生产级架构:稳健的错误处理、缓存和部署
无论您是经济学家、数据科学家还是政策分析师,该应用程序都展示了现代 AI 技术如何通过直观的界面和智能自动化,使复杂的经济数据变得更加易于获取和利用。
技术栈:Streamlit, DuckDB, Plotly, ModelScope API, World Bank API
数据源:世界银行 (2000-2024, 200+ 国家, 15,000+ 数据点)