flowchart TD
    A[User Interface<br/>Streamlit Web App] --> B[Location Services]
    A --> C[Weather Data API]
    A --> D[AI Integration Layer]
    A --> E[Visualization Engine]

    B --> F[Interactive Map<br/>Folium + OpenStreetMap]
    B --> G[City Search<br/>Nominatim Geocoding]

    C --> H[Open-Meteo API<br/>Weather + Air Quality]
    C --> I[Data Processing<br/>Pandas DataFrame]

    D --> J[ModelScope API<br/>DeepSeek-V3.2 AI]
    D --> K[Intelligent Analysis<br/>Weather Recommendations]

    E --> L[Altair Charts<br/>Temperature Trends]
    E --> M[Data Tables<br/>Weather Details]

    F --> A
    G --> A
    I --> E
    K --> A
Weather Forecast App with Streamlit and AI Integration
Python
Streamlit
AI
tutorial
Project Overview
In this comprehensive tutorial, I’ll guide you through creating a sophisticated weather forecast application that combines modern web development with artificial intelligence. This project demonstrates how to build a production-ready weather app with interactive maps, bilingual support, real-time data visualization, and AI-powered weather insights.
Live Demo: https://weather-trend.streamlit.app/
Github: https://github.com/JCwinning/weather_trend
This weather forecast application goes beyond basic weather data by integrating multiple advanced features:
- Interactive Location Selection: Click anywhere on the map or search by city name
- Bilingual Interface: Full English/Chinese language support with toggle functionality
- AI-Powered Insights: Weather analysis and recommendations using DeepSeek AI
- Advanced Visualization: Temperature trends, air quality monitoring, and rain probability
- Real-time Data: 7-day historical and 5-day forecast data
- Responsive Design: Works seamlessly across desktop, tablet, and mobile devices
Technical Architecture
Technology Stack
- Frontend Framework: Streamlit for rapid web application development
- Mapping: Folium with OpenStreetMap tiles for interactive location selection
- Data Visualization: Altair for professional charts and graphs
- API Integration: Open-Meteo for weather and air quality data
- AI Services: ModelScope API with DeepSeek-V3.2 for intelligent analysis
- Geocoding: Nominatim for address-to-coordinate conversion
- Internationalization: Custom language system for English/Chinese support
Getting Started
Prerequisites and Installation
Before we dive into the code, let’s set up our development environment:
# 1. Clone the repository
git clone <your-repo-url>
cd weather_trend

# 2. Install required packages
pip install streamlit pandas requests altair folium streamlit-folium geopy python-dotenv openai

# 3. Set up environment variables for AI features
echo "modelscope=your_api_key_here" > .env
Required Dependencies Explained
- streamlit: Web application framework with reactive UI components
- pandas: Data manipulation and analysis for weather datasets
- requests: HTTP client for API communication
- altair: Declarative statistical visualization library
- folium + streamlit-folium: Interactive map integration
- geopy: Geocoding services for location lookup
- python-dotenv: Environment variable management
- openai: AI model integration (compatible with ModelScope)
Core Features Implementation
1. Interactive Map with Location Selection
The map functionality allows users to click anywhere and get weather data for that exact location:
Code
import folium
from streamlit_folium import st_folium

# Create interactive map centered on default location
def create_interactive_map(lat=40.7128, lon=-74.0060, zoom=10):
    """Create an interactive Folium map"""
    m = folium.Map(
        location=[lat, lon],
        zoom_start=zoom,
        tiles="OpenStreetMap"
    )

    # Add click event handler to capture coordinates
    m.add_child(folium.LatLngPopup())

    return m

# Display map in Streamlit
if 'map_data' not in st.session_state:
    st.session_state.map_data = None

map_object = create_interactive_map()
st_data = st_folium(map_object, width=700, height=500)

# Capture clicked coordinates
if st_data['last_clicked']:
    lat = st_data['last_clicked']['lat']
    lon = st_data['last_clicked']['lng']
    st.session_state.clicked_location = (lat, lon)
    get_weather_for_coordinates(lat, lon)
Key Features: - Click-to-Select: Users can click anywhere on the map - Zoom Controls: Standard map navigation - Responsive Design: Adapts to different screen sizes - Coordinate Capture: Automatic extraction of clicked locations
2. Bilingual City Search System
The app supports both English and Chinese city names with intelligent fallback:
Code
import re
from geopy.geocoders import Nominatim

# Extended Chinese character detection
def contains_chinese(text):
    """Check if text contains Chinese characters including CJK Unified Ideographs"""
    chinese_pattern = re.compile(
        r"[\u4e00-\u9fff\u3400-\u4dbf\U00020000-\U0002a6df\U0002a700-\U0002b73f]"
    )
    return bool(chinese_pattern.search(text))

# Chinese city mapping for better geocoding
CHINESE_CITY_MAPPING = {
    "纽约": "New York",
    "东京": "Tokyo",
    "伦敦": "London",
    "巴黎": "Paris",
    "洛杉矶": "Los Angeles",
    # ... more mappings
}

def get_coordinates_for_city(city_name):
    """Get coordinates for city with multilingual support"""
    # Check for Chinese city name mapping
    if contains_chinese(city_name) and city_name in CHINESE_CITY_MAPPING:
        city_name = CHINESE_CITY_MAPPING[city_name]

    # Geocode the city
    geolocator = Nominatim(user_agent="weather_app")
    try:
        location = geolocator.geocode(city_name)
        return (location.latitude, location.longitude) if location else None
    except:
        return None
Bilingual Features: - Chinese Character Detection: Advanced regex pattern for CJK characters - City Name Mapping: Translation database for major cities - Fallback Handling: Graceful degradation when geocoding fails - Unicode Support: Full international character support
3. Weather Data Integration
The application fetches comprehensive weather data from Open-Meteo API:
Code
import requests
import pandas as pd

def get_weather_data(latitude, longitude):
    """Fetch 12-day weather data (7 historical + 5 forecast)"""

    # API endpoint configuration
    url = "https://api.open-meteo.com/v1/forecast"
    params = {
        'latitude': latitude,
        'longitude': longitude,
        'daily': [
            'temperature_2m_max', 'temperature_2m_min', 'temperature_2m_mean',
            'weathercode', 'windspeed_10m_max', 'precipitation_probability_max',
            'pm10', 'pm2_5'
        ],
        'timezone': 'auto',
        'past_days': 7,  # Get historical data
        'forecast_days': 5  # Get future forecast
    }

    try:
        response = requests.get(url, params=params, timeout=10)
        response.raise_for_status()

        # Process response data
        data = response.json()
        df = process_weather_data(data)

        return df

    except requests.RequestException as e:
        st.error(f"API request failed: {e}")
        return None

def process_weather_data(data):
    """Convert API response to structured DataFrame"""
    daily_data = data['daily']

    # Create date range (historical + future)
    dates = pd.date_range(
        start=pd.to_datetime(daily_data['time'][0]),
        periods=len(daily_data['time']),
        freq='D'
    )

    # Build DataFrame
    df = pd.DataFrame({
        'date': dates,
        'temperature_max': daily_data['temperature_2m_max'],
        'temperature_min': daily_data['temperature_2m_min'],
        'temperature_mean': daily_data['temperature_2m_mean'],
        'weather_code': daily_data['weathercode'],
        'wind_speed_max': daily_data['windspeed_10m_max'],
        'rain_probability': daily_data['precipitation_probability_max'],
        'pm2_5': daily_data.get('pm2_5', [0] * len(dates))
    })

    # Add derived columns
    df['is_today'] = df['date'].dt.date == pd.Timestamp.now().date()
    df['is_future'] = df['date'] > pd.Timestamp.now()

    return df
Data Processing Features: - Historical + Forecast: 7 days past + 5 days future - Air Quality Integration: PM2.5 and PM10 data - Derived Metrics: Today detection and future projection - Error Handling: Robust API error management
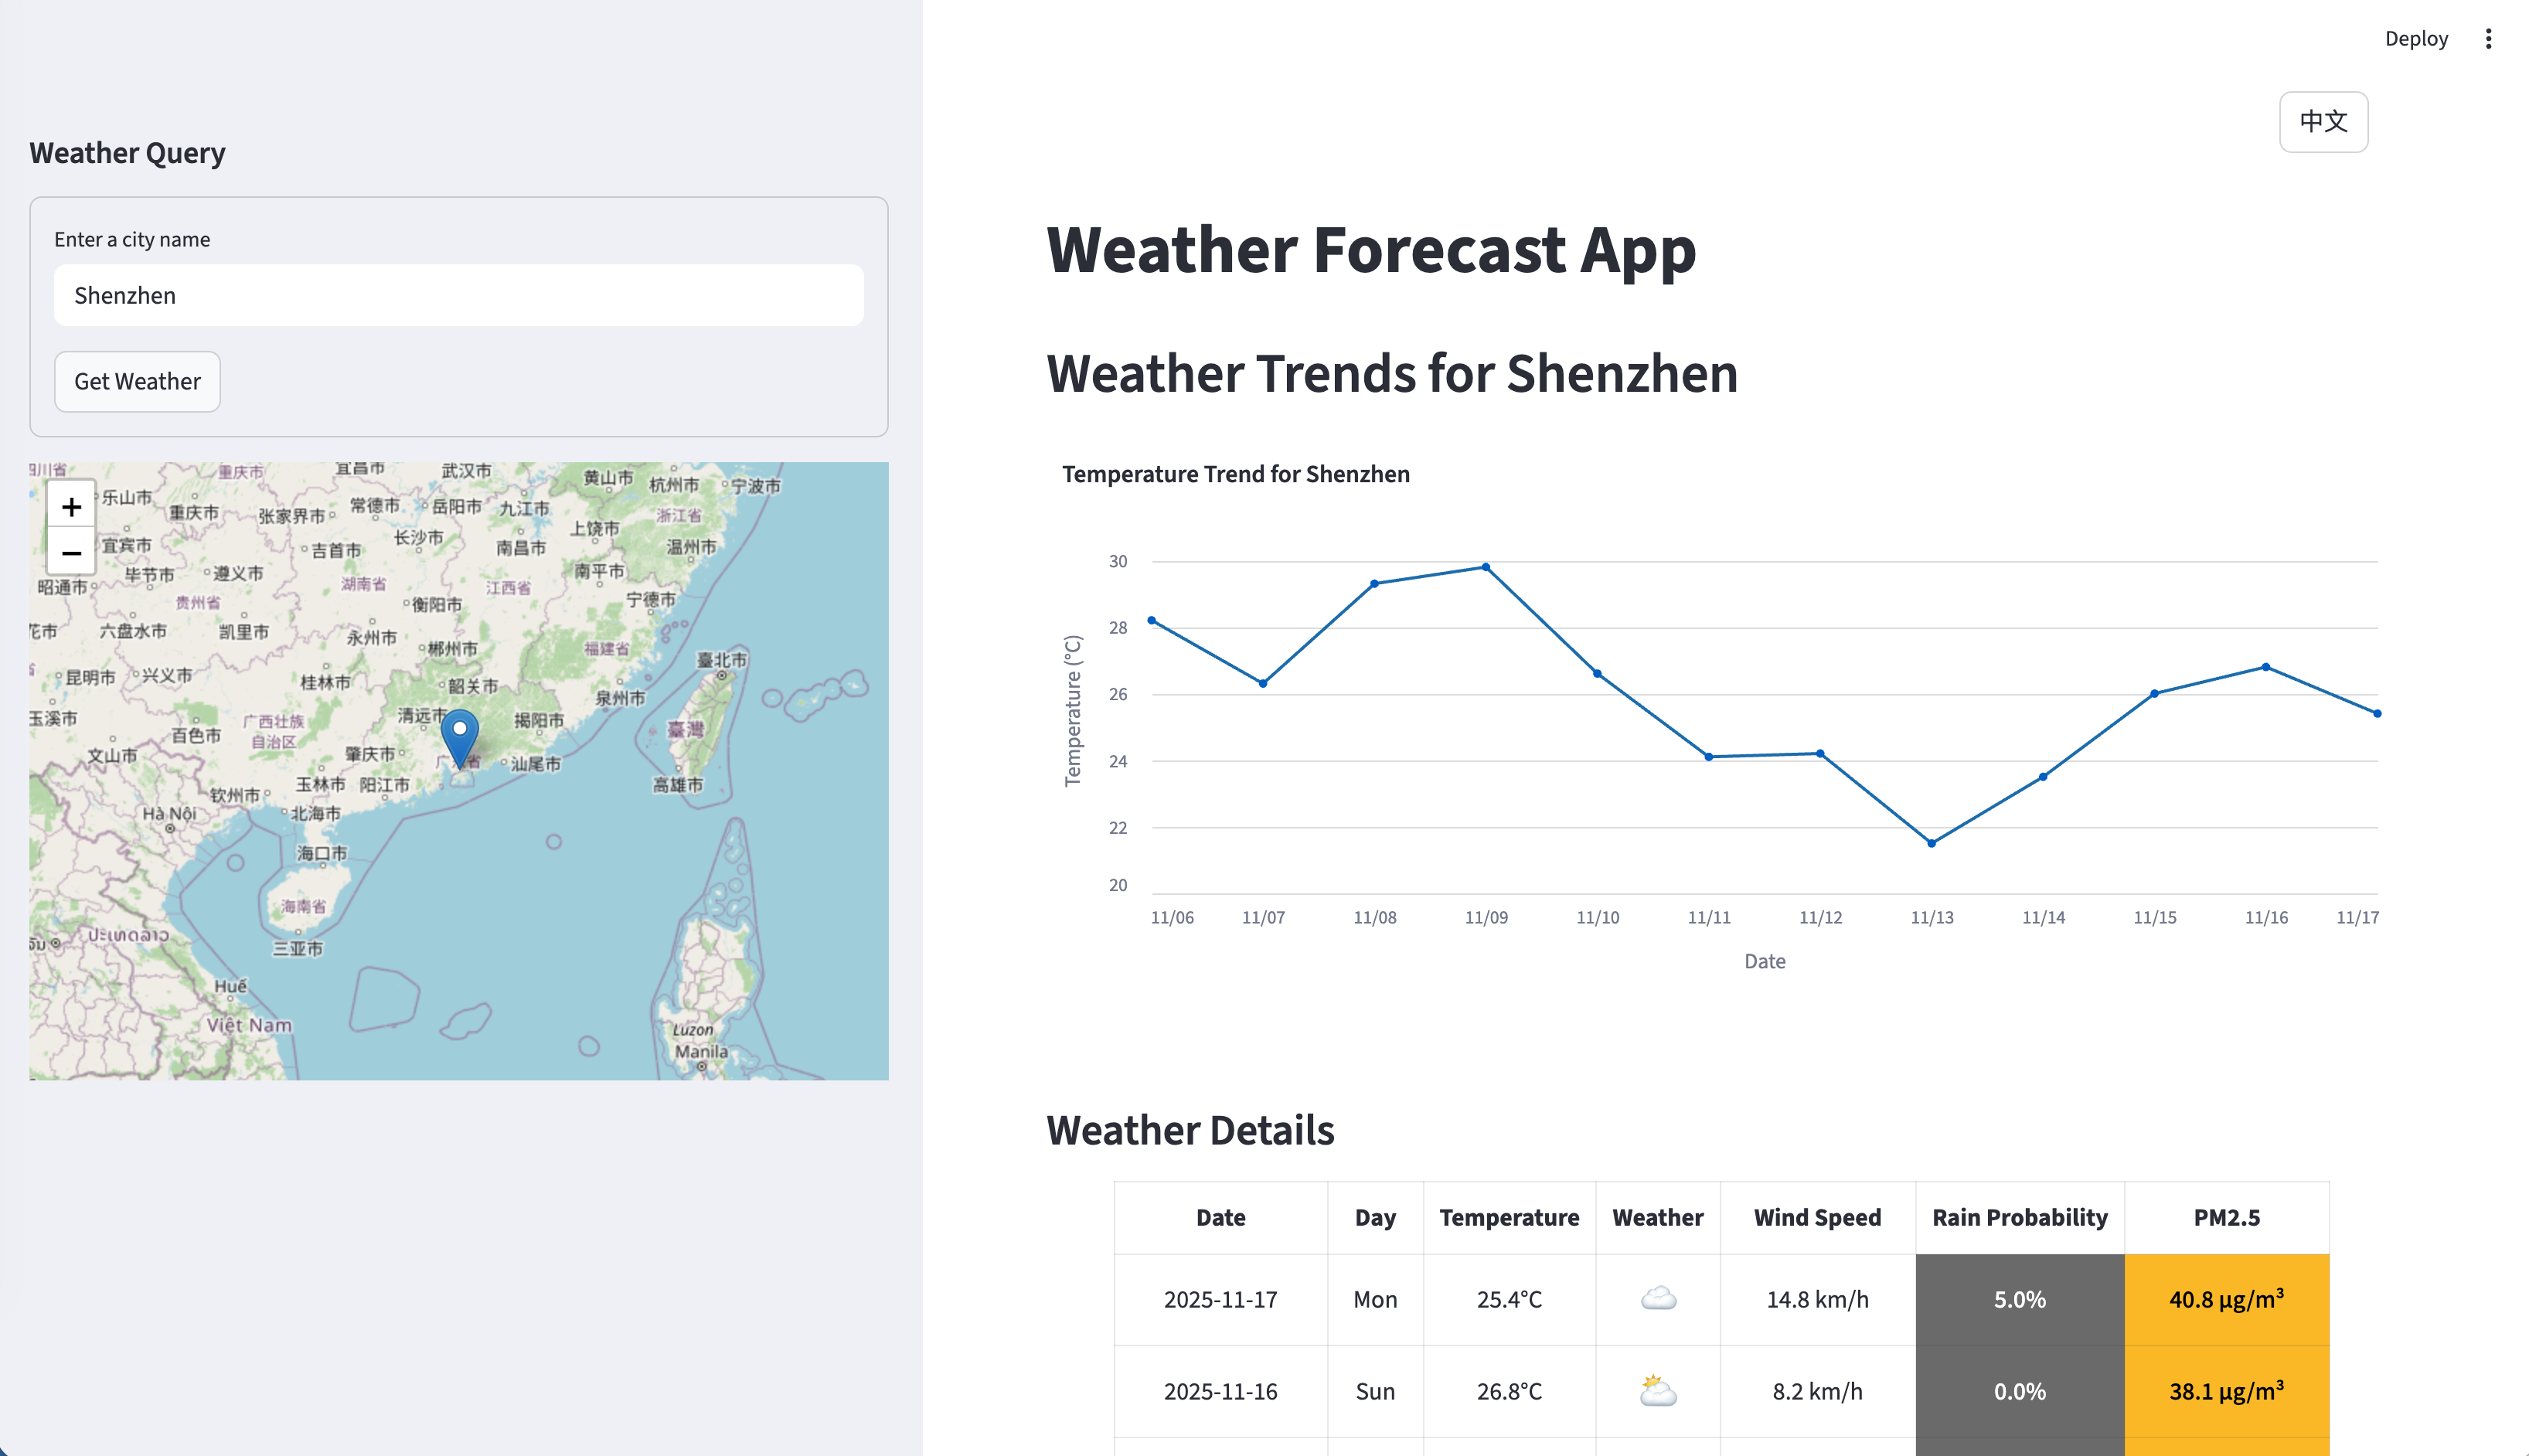
4. Advanced Data Visualization
Temperature trends with clear visual distinction between historical and forecast data:
Code
import altair as alt

def create_temperature_chart(weather_df):
    """Create interactive temperature trend chart"""

    # Base chart with temperature line
    base_chart = alt.Chart(weather_df).mark_line(
        point=True,
        strokeWidth=3,
        opacity=0.8
    ).encode(
        x=alt.X('date:T', title='Date'),
        y=alt.Y('temperature_mean:Q', title='Temperature (°C)', scale=alt.Scale(domain=[weather_df['temperature_min'].min()-5, weather_df['temperature_max'].max()+5]))
    ).properties(
        width=800,
        height=400,
        title='Temperature Trends'
    )

    # Historical data (solid line)
    historical_data = weather_df[weather_df['is_future'] == False]
    historical_line = base_chart.transform_filter(
        'datum.is_future == false'
    ).encode(
        color=alt.value('blue'),
        strokeDash=alt.value([0])  # Solid line
    )

    # Future forecast (dotted line)
    future_data = weather_df[weather_df['is_future'] == True]
    future_line = base_chart.transform_filter(
        'datum.is_future == true'
    ).encode(
        color=alt.value('red'),
        strokeDash=alt.value([5, 5])  # Dotted line
    )

    # Today indicator
    today_line = alt.Chart(pd.DataFrame({'x': [pd.Timestamp.now()]})).mark_rule(
        strokeDash=[2, 2],
        stroke='green',
        strokeWidth=2
    ).encode(x='x:T')

    return (historical_line + future_line + today_line).resolve_scale(color='independent')
Visualization Features: - Line Style Differentiation: Solid (historical) vs Dotted (forecast) - Today Indicator: Clear visual marker for current day - Color Coding: Blue for past, red for future - Interactive Tooltips: Hover information for data points
5. Air Quality Monitoring
PM2.5 levels with EPA-compliant color coding:
Code
def get_air_quality_level(pm25_value):
    """Get air quality level based on US EPA PM2.5 standards"""

    if pm25_value <= 12:
        return {
            'level': 'Good',
            'color': '#00e400',  # Deeper green
            'text_color': 'white',
            'icon': '🟢'
        }
    elif pm25_value <= 35.4:
        return {
            'level': 'Moderate',
            'color': '#ffff00',  # Light green
            'text_color': 'black',
            'icon': '🟢'
        }
    elif pm25_value <= 55.4:
        return {
            'level': 'Unhealthy for Sensitive Groups',
            'color': '#ff7e00',  # Darker yellow
            'text_color': 'black',
            'icon': '🟡'
        }
    elif pm25_value <= 150.4:
        return {
            'level': 'Unhealthy',
            'color': '#ff0000',  # Darker orange
            'text_color': 'white',
            'icon': '🟠'
        }
    elif pm25_value <= 250.4:
        return {
            'level': 'Very Unhealthy',
            'color': '#8f3f97',  # Darker red
            'text_color': 'white',
            'icon': '🔴'
        }
    else:
        return {
            'level': 'Hazardous',
            'color': '#7e0023',  # Very dark red
            'text_color': 'white',
            'icon': '⚫'
        }

def display_air_quality_badge(pm25_value):
    """Display air quality with visual indicators"""
    aq_info = get_air_quality_level(pm25_value)

    st.markdown(f"""
    <div style="background-color: {aq_info['color']}; color: {aq_info['text_color']};
                padding: 10px; border-radius: 5px; text-align: center; margin: 5px 0;">
        <strong>{aq_info['icon']} PM2.5: {pm25_value} μg/m³</strong><br>
        <small>{aq_info['level']}</small>
    </div>
    """, unsafe_allow_html=True)
Air Quality Features: - EPA Standards: Based on US Environmental Protection Agency - Visual Indicators: Color-coded badges with icons - Accessibility: High contrast colors for readability - Educational: Level descriptions for user understanding
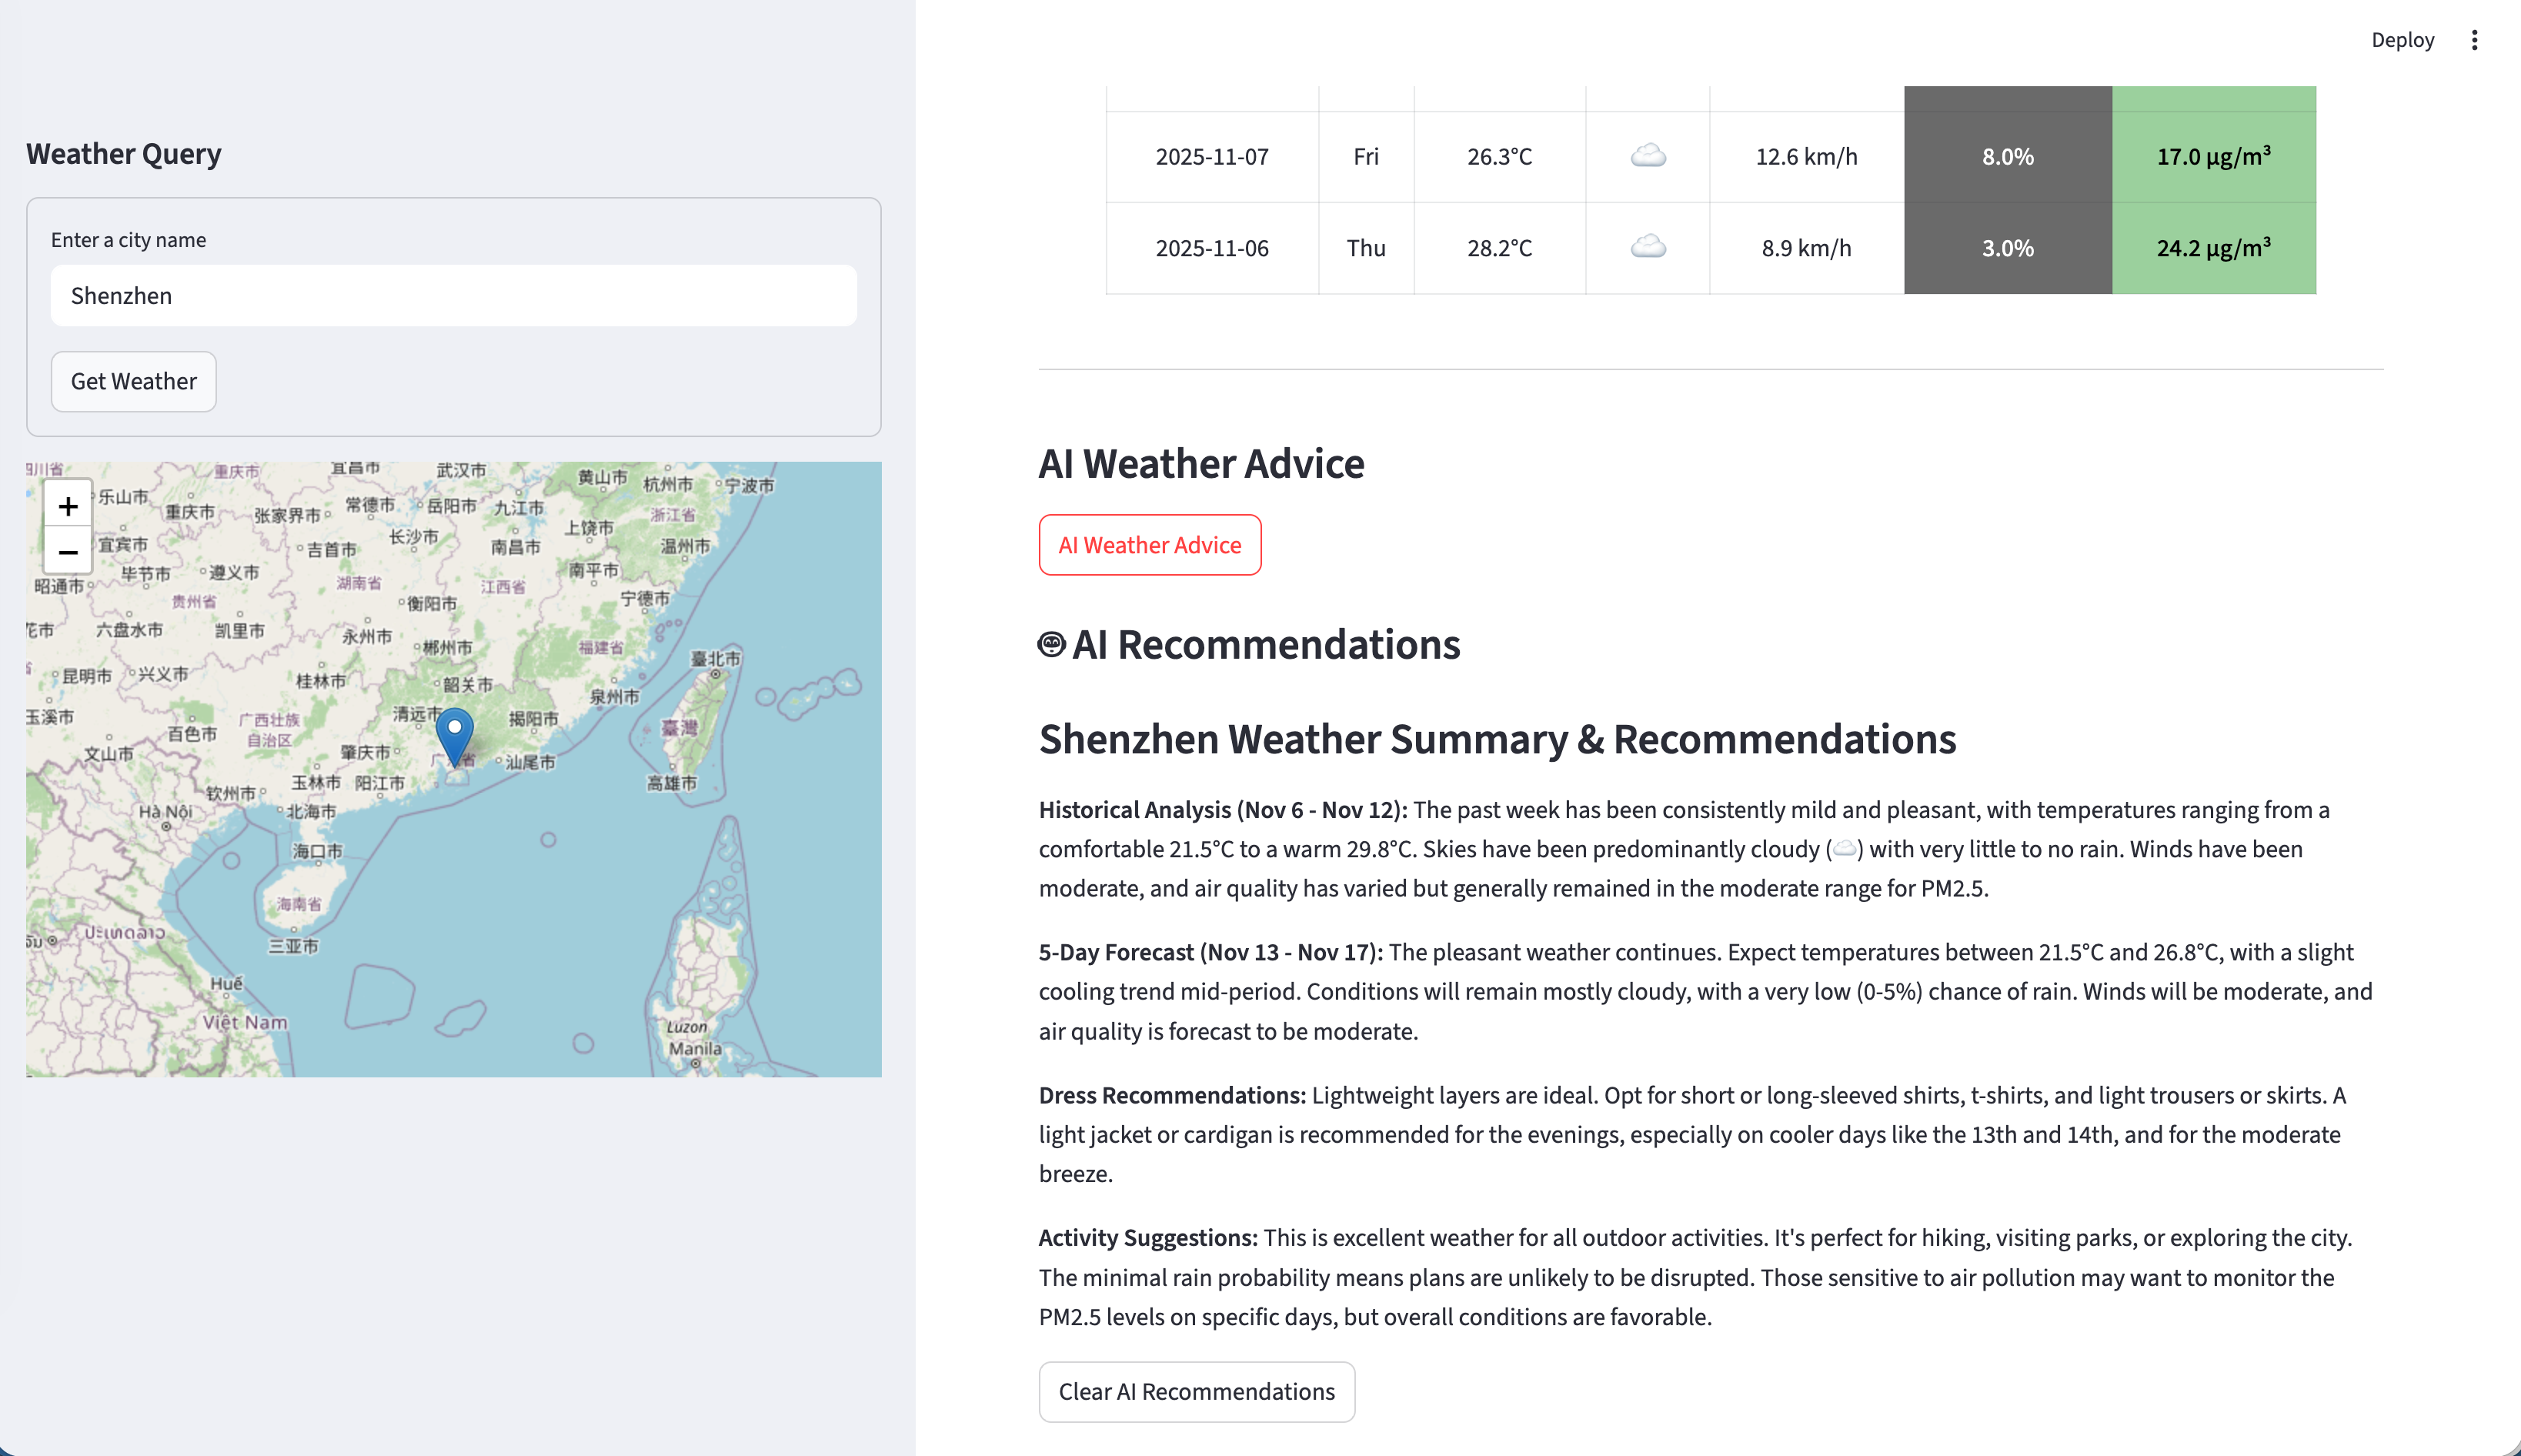
AI-Powered Weather Intelligence
Integration with DeepSeek AI
The most innovative feature is AI-powered weather analysis using ModelScope’s DeepSeek-V3.2 model:
Code
from openai import OpenAI
import os

# Initialize AI client with ModelScope
def init_ai_client():
    """Initialize OpenAI client for ModelScope API"""
    return OpenAI(
        base_url="https://dashscope.aliyuncs.com/compatible-mode/v1",
        api_key=os.getenv("modelscope"),
    )

def generate_weather_insights(weather_df, location_name, language="en"):
    """Generate AI-powered weather recommendations"""

    # Prepare weather data for AI analysis
    today_index = weather_df[weather_df['is_today']].index[0] if any(weather_df['is_today']) else 0
    historical_data = weather_df.iloc[:today_index+1]  # Up to today
    future_data = weather_df.iloc[today_index:]  # Today onwards

    # Create weather summary for AI
    weather_summary = f"""
    Location: {location_name}

    Historical Weather (Last {len(historical_data)} days):
    - Temperature Range: {historical_data['temperature_min'].min():.1f}°C to {historical_data['temperature_max'].max():.1f}°C
    - Average Temperature: {historical_data['temperature_mean'].mean():.1f}°C
    - Air Quality Range: {historical_data['pm2_5'].min():.1f} to {historical_data['pm2_5'].max():.1f} PM2.5

    Forecast (Next {len(future_data)} days):
    - Temperature Range: {future_data['temperature_min'].min():.1f}°C to {future_data['temperature_max'].max():.1f}°C
    - Average Rain Probability: {future_data['rain_probability'].mean():.0f}%
    """

    # Generate prompt based on language
    if language == "zh":
        prompt = f"""
        基于以下天气数据,请提供简洁实用的天气建议(100-200字):

        {weather_summary}

        请包括:
        1. 天气模式分析
        2. 穿衣建议
        3. 户外活动建议
        4. 健康注意事项(如空气质量相关)

        请用中文回复,语气友好实用。
        """
    else:
        prompt = f"""
        Based on the following weather data, please provide concise and practical weather advice (100-200 words):

        {weather_summary}

        Please include:
        1. Weather pattern analysis
        2. Clothing recommendations
        3. Outdoor activity suggestions
        4. Health considerations (related to air quality if applicable)

        Please respond in {language} with a friendly and practical tone.
        """

    try:
        client = init_ai_client()
        response = client.chat.completions.create(
            model="deepseek-ai/DeepSeek-V3",
            messages=[{"role": "user", "content": prompt}],
            max_tokens=300,
            temperature=0.7
        )

        return response.choices[0].message.content

    except Exception as e:
        return f"AI service temporarily unavailable. Error: {str(e)}"

# In Streamlit app
if st.button(get_text("ai_button", language)):
    with st.spinner("Getting AI weather advice..."):
        if 'weather_df' in st.session_state and 'location_name' in st.session_state:
            ai_insights = generate_weather_insights(
                st.session_state.weather_df,
                st.session_state.location_name,
                language
            )
            st.markdown("### 🤖 AI Weather Analysis")
            st.write(ai_insights)
        else:
            st.warning("Please get weather data first.")
AI Features: - Context-Aware Analysis: Processes both historical and forecast data - Multilingual Support: AI responds in user’s selected language - Practical Recommendations: Clothing, activities, and health advice - Error Handling: Graceful fallback when AI service unavailable
AI Prompt Engineering
The AI system uses carefully crafted prompts to generate useful insights:
Prompt Structure: 1. Data Context: Comprehensive weather statistics 2. Task Definition: Clear requirements for analysis 3. Output Format: Structured response categories 4. Language Adaptation: Matches user interface language
Response Categories: - Weather Pattern Analysis: Trends and anomalies - Clothing Recommendations: Practical dress suggestions - Activity Advice: Outdoor planning recommendations - Health Considerations: Air quality and weather impacts
Internationalization System
Language Management Architecture
The app implements a comprehensive bilingual system:
Code
# language.py - Translation management
TRANSLATIONS = {
    "en": {
        "app_title": "Weather Forecast App",
        "sidebar_header": "Weather Query",
        "city_input_placeholder": "Enter a city name",
        "get_weather_button": "Get Weather",
        "weather_trends_title": "Weather Trends for",
        "ai_button": "AI Weather Advice",
        # ... more translations
    },
    "zh": {
        "app_title": "天气预报应用",
        "sidebar_header": "天气查询",
        "city_input_placeholder": "输入城市名称",
        "get_weather_button": "获取天气",
        "weather_trends_title": "天气趋势",
        "ai_button": "AI天气建议",
        # ... more translations
    }
}

def get_text(key, language="en"):
    """Get translated text for given key and language"""
    return TRANSLATIONS.get(language, {}).get(key, key)

def get_available_languages():
    """Get available language options"""
    return {"en": "English", "zh": "中文"}

# In main app (app.py)
def main():
    # Language state management
    if 'language' not in st.session_state:
        st.session_state.language = "en"

    # Language toggle button
    current_lang = st.session_state.language
    available_langs = get_available_languages()

    col1, col2, col3 = st.columns([1,1,6])
    with col1:
        if st.button("EN", disabled=current_lang=="en"):
            st.session_state.language = "en"
            st.rerun()

    with col2:
        if st.button("中文", disabled=current_lang=="zh"):
            st.session_state.language = "zh"
            st.rerun()

    # Use current language for all UI elements
    language = st.session_state.language
    st.title(get_text("app_title", language))
    st.sidebar.header(get_text("sidebar_header", language))
Internationalization Features: - Complete UI Translation: All interface elements localized - Dynamic Language Switching: Instant UI updates on language change - Chinese Character Support: Full Unicode and CJK support - Consistent Language: AI responses match UI language
Advanced UI Components
Weather Data Table with Visual Indicators
The weather table combines data with visual elements for quick understanding:
Code
def create_weather_table(weather_df, language="en"):
    """Create enhanced weather table with icons and colors"""

    # Weather code to emoji mapping
    WEATHER_ICONS = {
        0: "☀️",   # Clear sky
        1: "⛅",   # Mainly clear
        2: "☁️",   # Partly cloudy
        3: "☁️",   # Overcast
        45: "🌫️",  # Fog
        48: "🌦️",  # Drizzle
        51: "🌧️",  # Rain
        53: "❄️",  # Snow
        95: "⛈️",  # Thunderstorm
    }

    def format_weather_row(row):
        """Format individual weather row with styling"""
        date_str = row['date'].strftime('%Y-%m-%d')
        temp_range = f"{row['temperature_min']:.1f}° ~ {row['temperature_max']:.1f}°"
        weather_icon = WEATHER_ICONS.get(row['weather_code'], "🌡️")

        # Air quality badge
        aq_info = get_air_quality_level(row['pm2_5'])
        aq_badge = f'<span style="background-color: {aq_info["color"]}; color: {aq_info["text_color"]}; padding: 2px 6px; border-radius: 3px; font-size: 0.8em;">{aq_info["icon"]} {row["pm2_5"]:.0f}</span>'

        # Rain probability indicator
        rain_color = 'red' if row['rain_probability'] >= 80 else 'orange' if row['rain_probability'] >= 50 else 'gray'
        rain_indicator = f'<span style="color: {rain_color};">🔴 {row["rain_probability"]:.0f}%</span>' if row['rain_probability'] >= 50 else f'<span style="color: {rain_color};">🟢 {row["rain_probability"]:.0f}%</span>'

        # Today highlighting
        row_style = 'font-size: 1.2em; font-weight: bold;' if row['is_today'] else ''

        return {
            'Date': f'<span style="{row_style}">{date_str}</span>',
            'Weather': f'<span style="{row_style}">{weather_icon}</span>',
            'Temperature': f'<span style="{row_style}">{temp_range}</span>',
            'Wind': f'<span style="{row_style}">💨 {row["wind_speed_max"]:.1f} km/h</span>',
            'Rain': rain_indicator,
            'Air Quality': aq_badge
        }

    # Apply formatting to all rows
    formatted_rows = [format_weather_row(row) for _, row in weather_df.iterrows()]

    return pd.DataFrame(formatted_rows)

# Display in Streamlit
st.markdown("### 📊 Weather Details")
st.dataframe(
    create_weather_table(weather_df, language),
    width=1200,
    hide_index=True,
    unsafe_allow_html=True
)
Table Features: - Weather Icons: Emoji representation for quick visual understanding - Today Highlighting: Larger, bold text for current day - Air Quality Badges: Color-coded PM2.5 indicators - Rain Probability: Visual indicators with Material Design colors - Responsive Layout: Adapts to different screen sizes
Deployment and Production
Environment Configuration
For production deployment, configure environment variables:
# .env file
modelscope=your_modelscope_api_key_here

# Additional production settings
# Consider rate limiting, caching, and monitoring
Streamlit Cloud Deployment
# 1. Install Streamlit CLI
pip install streamlit

# 2. Login to Streamlit
streamlit login

# 3. Deploy to Streamlit Cloud
streamlit run app.py  # Test locally first
# Then deploy through cloud.streamlit.io or using CLI
Docker Deployment (Optional)
FROM python:3.9-slim

WORKDIR /app

COPY requirements.txt .
RUN pip install -r requirements.txt

COPY . .

EXPOSE 8501

CMD ["streamlit", "run", "app.py", "--server.address", "0.0.0.0"]
Performance Optimization
Caching Strategy
@st.cache_data(ttl=3600)  # Cache for 1 hour
def get_weather_data_cached(lat, lon):
    """Cached weather data fetching"""
    return get_weather_data(lat, lon)

@st.cache_resource
def get_ai_client():
    """Cached AI client initialization"""
    return init_ai_client()

# Cache map generation
@st.cache_data(ttl=3600)
def create_map_cached(lat, lon):
    """Cached map creation"""
    return create_interactive_map(lat, lon)
Error Handling and Resilience
Code
def robust_api_call(func, *args, max_retries=3, **kwargs):
    """Robust API calling with retry logic"""
    for attempt in range(max_retries):
        try:
            return func(*args, **kwargs)
        except requests.exceptions.Timeout:
            if attempt == max_retries - 1:
                st.error("Weather service temporarily unavailable")
                return None
            time.sleep(2 ** attempt)  # Exponential backoff
        except requests.exceptions.RequestException as e:
            st.error(f"API error: {e}")
            return None
Best Practices and Lessons Learned
Development Insights
- Modular Architecture: Separate concerns (API, UI, AI, Visualization)
- Error Resilience: Comprehensive error handling and fallbacks
- User Experience: Fast loading with caching and progress indicators
- Internationalization: Plan for multilingual support from the start
- API Management: Rate limiting and request optimization
- Responsive Design: Test across different devices and screen sizes
- Security: Environment variables for sensitive data
Performance Considerations
- Data Caching: 1-hour TTL for weather data
- Lazy Loading: Load components only when needed
- Async Operations: Non-blocking API calls where possible
- Optimization: Minimize re-renders and state updates
Future Enhancements
Potential Improvements
- Extended AI Capabilities:
- Multi-day activity planning
- Personalized recommendations based on user preferences
- Integration with calendar applications
- Advanced Visualizations:
- Wind direction and speed maps
- Precipitation intensity charts
- Historical weather comparisons
- Data Sources:
- Multiple weather provider integration
- Real-time radar integration
- Weather alert systems
- User Features:
- Saved locations and favorites
- Weather notifications
- Historical data analysis
- Export functionality
- Technical Enhancements:
- WebSocket real-time updates
- Progressive Web App (PWA) features
- Offline functionality
Conclusion
This weather forecast application demonstrates how modern web development technologies can be combined to create a comprehensive, intelligent weather service. The integration of AI-powered recommendations elevates it from a simple data display tool to a practical weather assistant that helps users make informed decisions about their daily activities.
The project showcases:
Modern Web Development: Streamlit for rapid prototyping
Data Visualization: Professional charts and interactive maps
AI Integration: Practical use of language models for data analysis
Internationalization: Complete bilingual support
Production Readiness: Error handling, caching, and optimization
Whether you’re building weather applications, data dashboards, or AI-powered tools, this project provides an excellent foundation for creating sophisticated, user-friendly applications.