flowchart TD
    A[World Bank API] --> B[Data Collection<br/>download_data.py]
    B --> C[Data Processing<br/>Country Mapping, Indicator Calculation]
    C --> D[Data Storage<br/>CSV Files]

    D --> E[Streamlit App<br/>app.py]
    E --> F[DuckDB<br/>In-Memory SQL]

    F --> G[Visualization Engine<br/>Plotly Express]
    F --> H[AI Query Engine<br/>ModelScope API]
    F --> I[Session Management<br/>User State]

    G --> J[Interactive Charts]
    H --> K[Natural Language<br/>to SQL]
    I --> L[Persistent<br/>Query Results]

    J --> M[User Interface]
    K --> M
    L --> M
Interactive GDP Trend Dashboard with AI SQL
Data Visualization
Streamlit
Economic Analysis
AI
Project Overview
The GDP Trend Dashboard is a sophisticated web application that visualizes and analyzes economic data from the World Bank API. What makes this system unique is its dual approach: traditional interactive visualizations combined with AI-powered natural language querying, making economic data accessible to both technical analysts and general users.
Live Demo: https://world-GDP-trend.streamlit.app
Github: https://github.com/JCwinning/GDP_trend
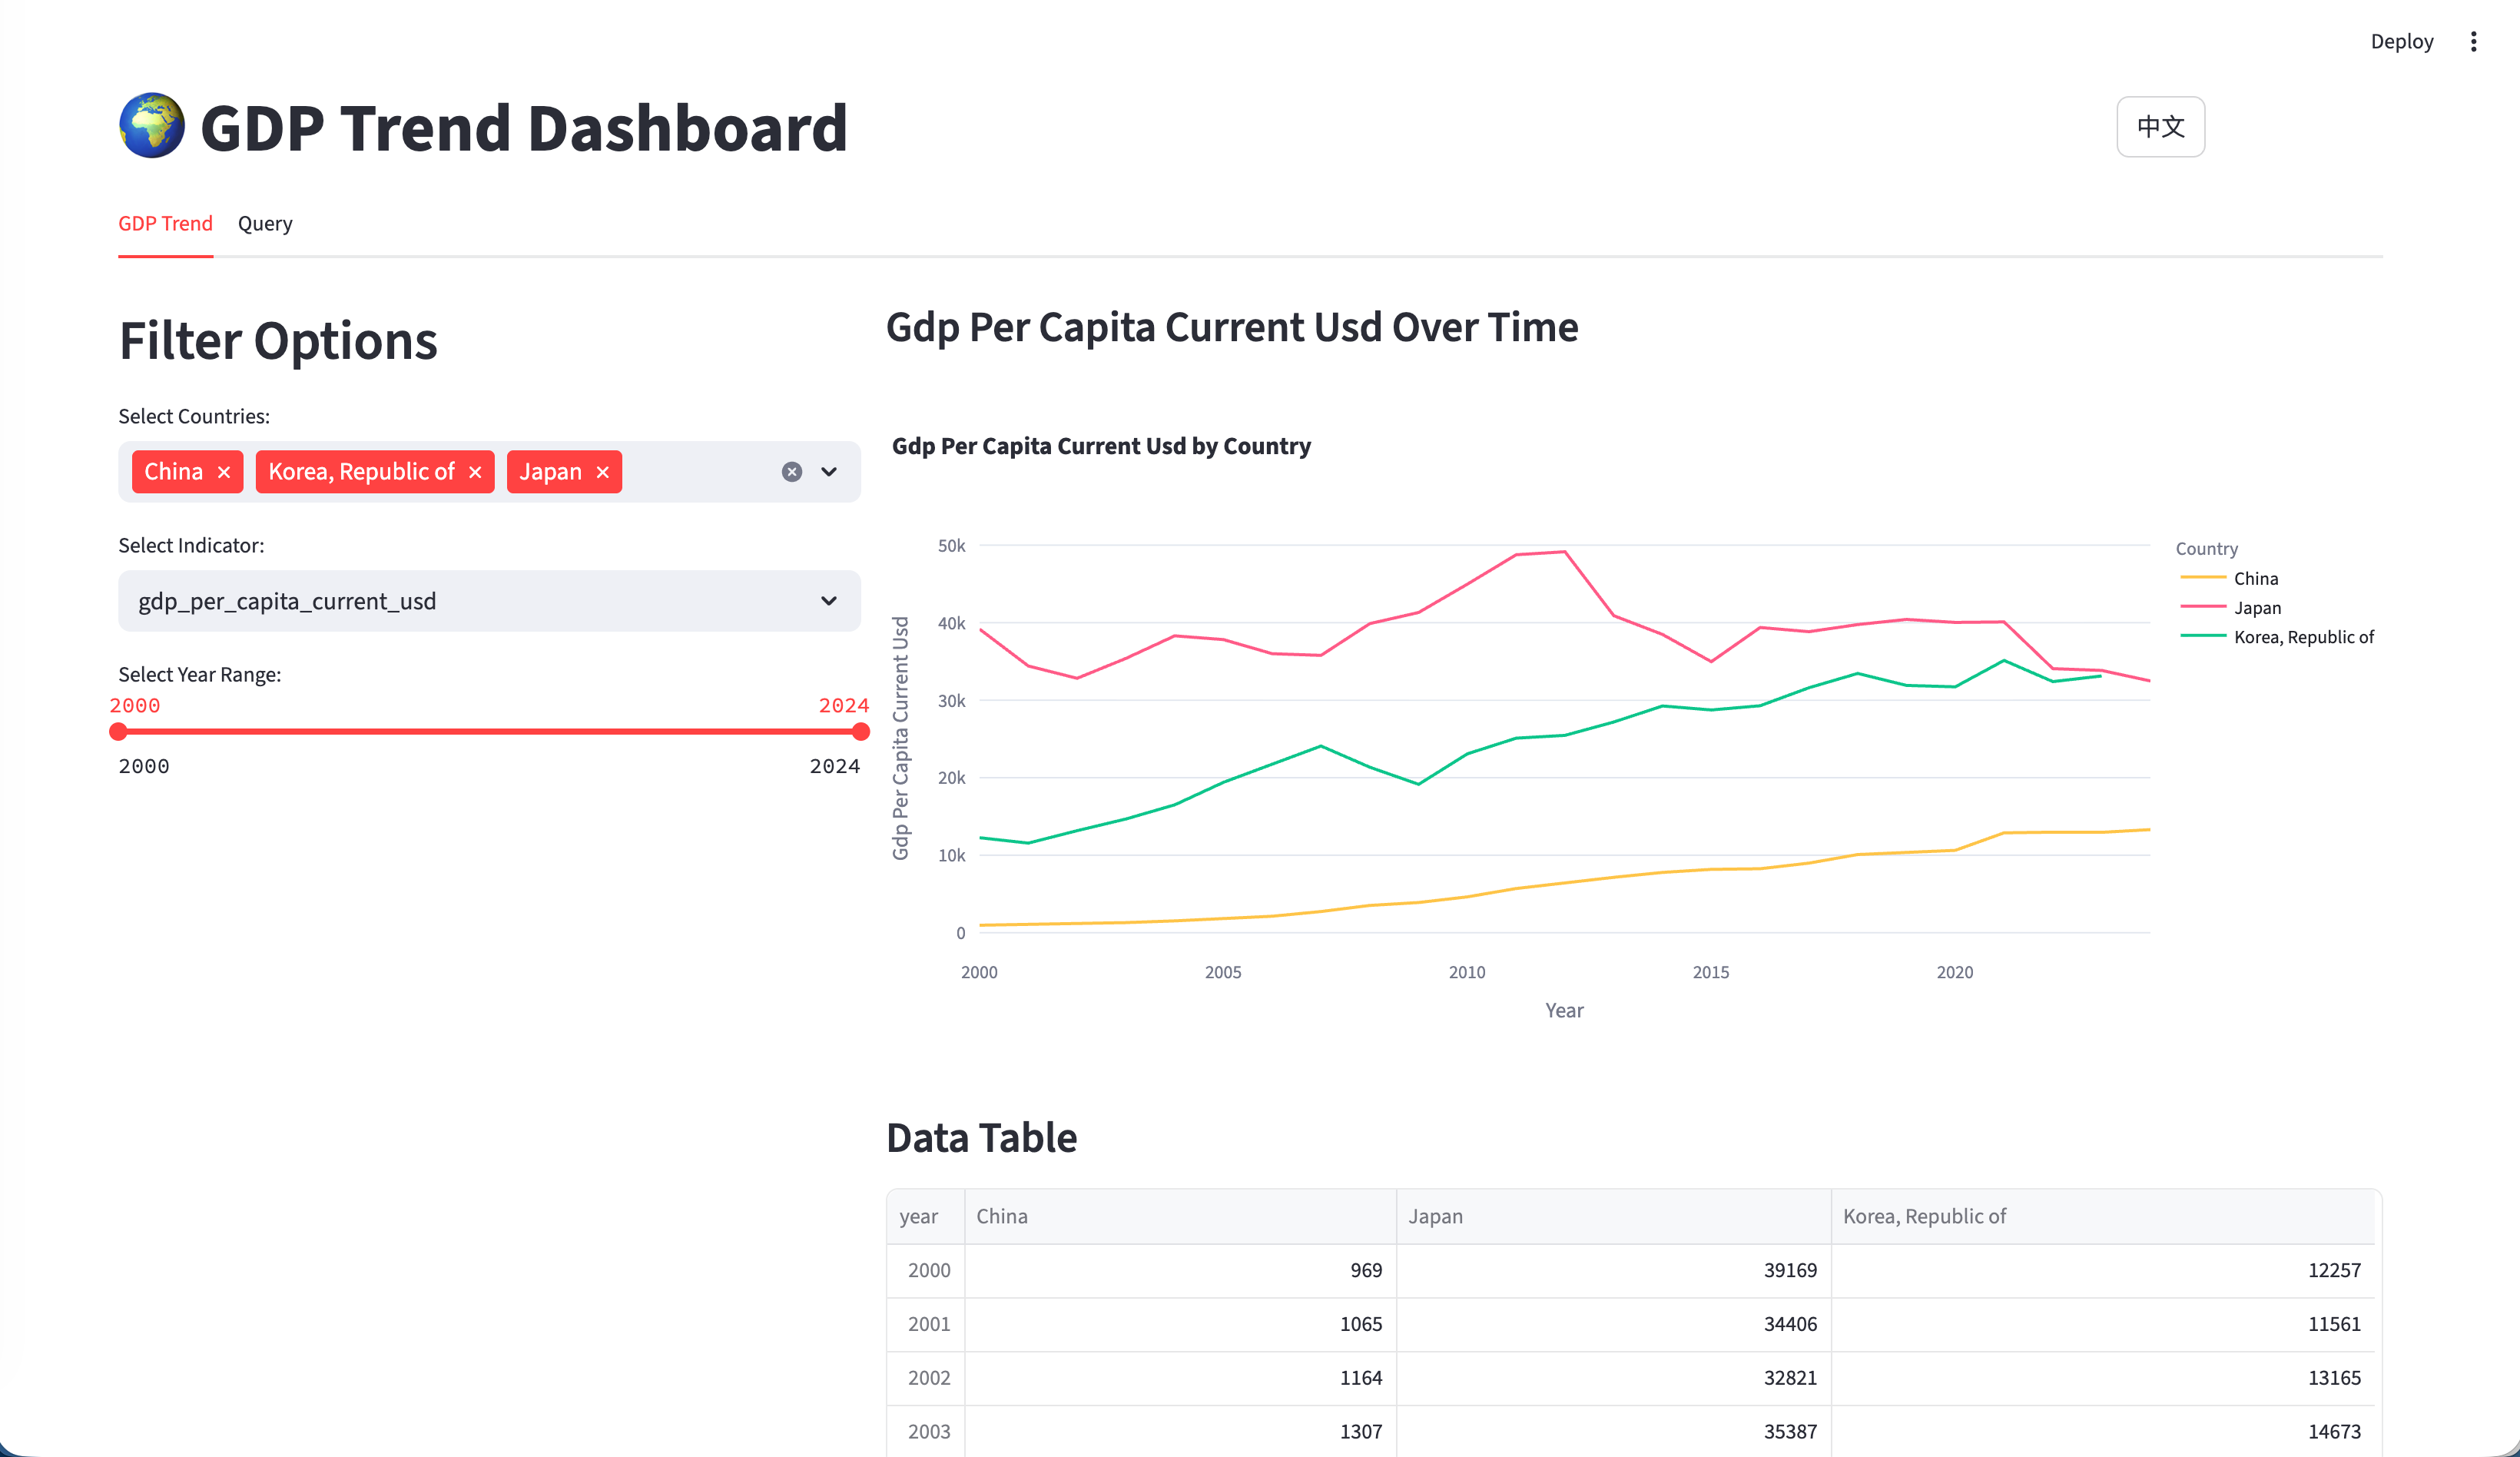
Interactive Global GDP Trend Visualization
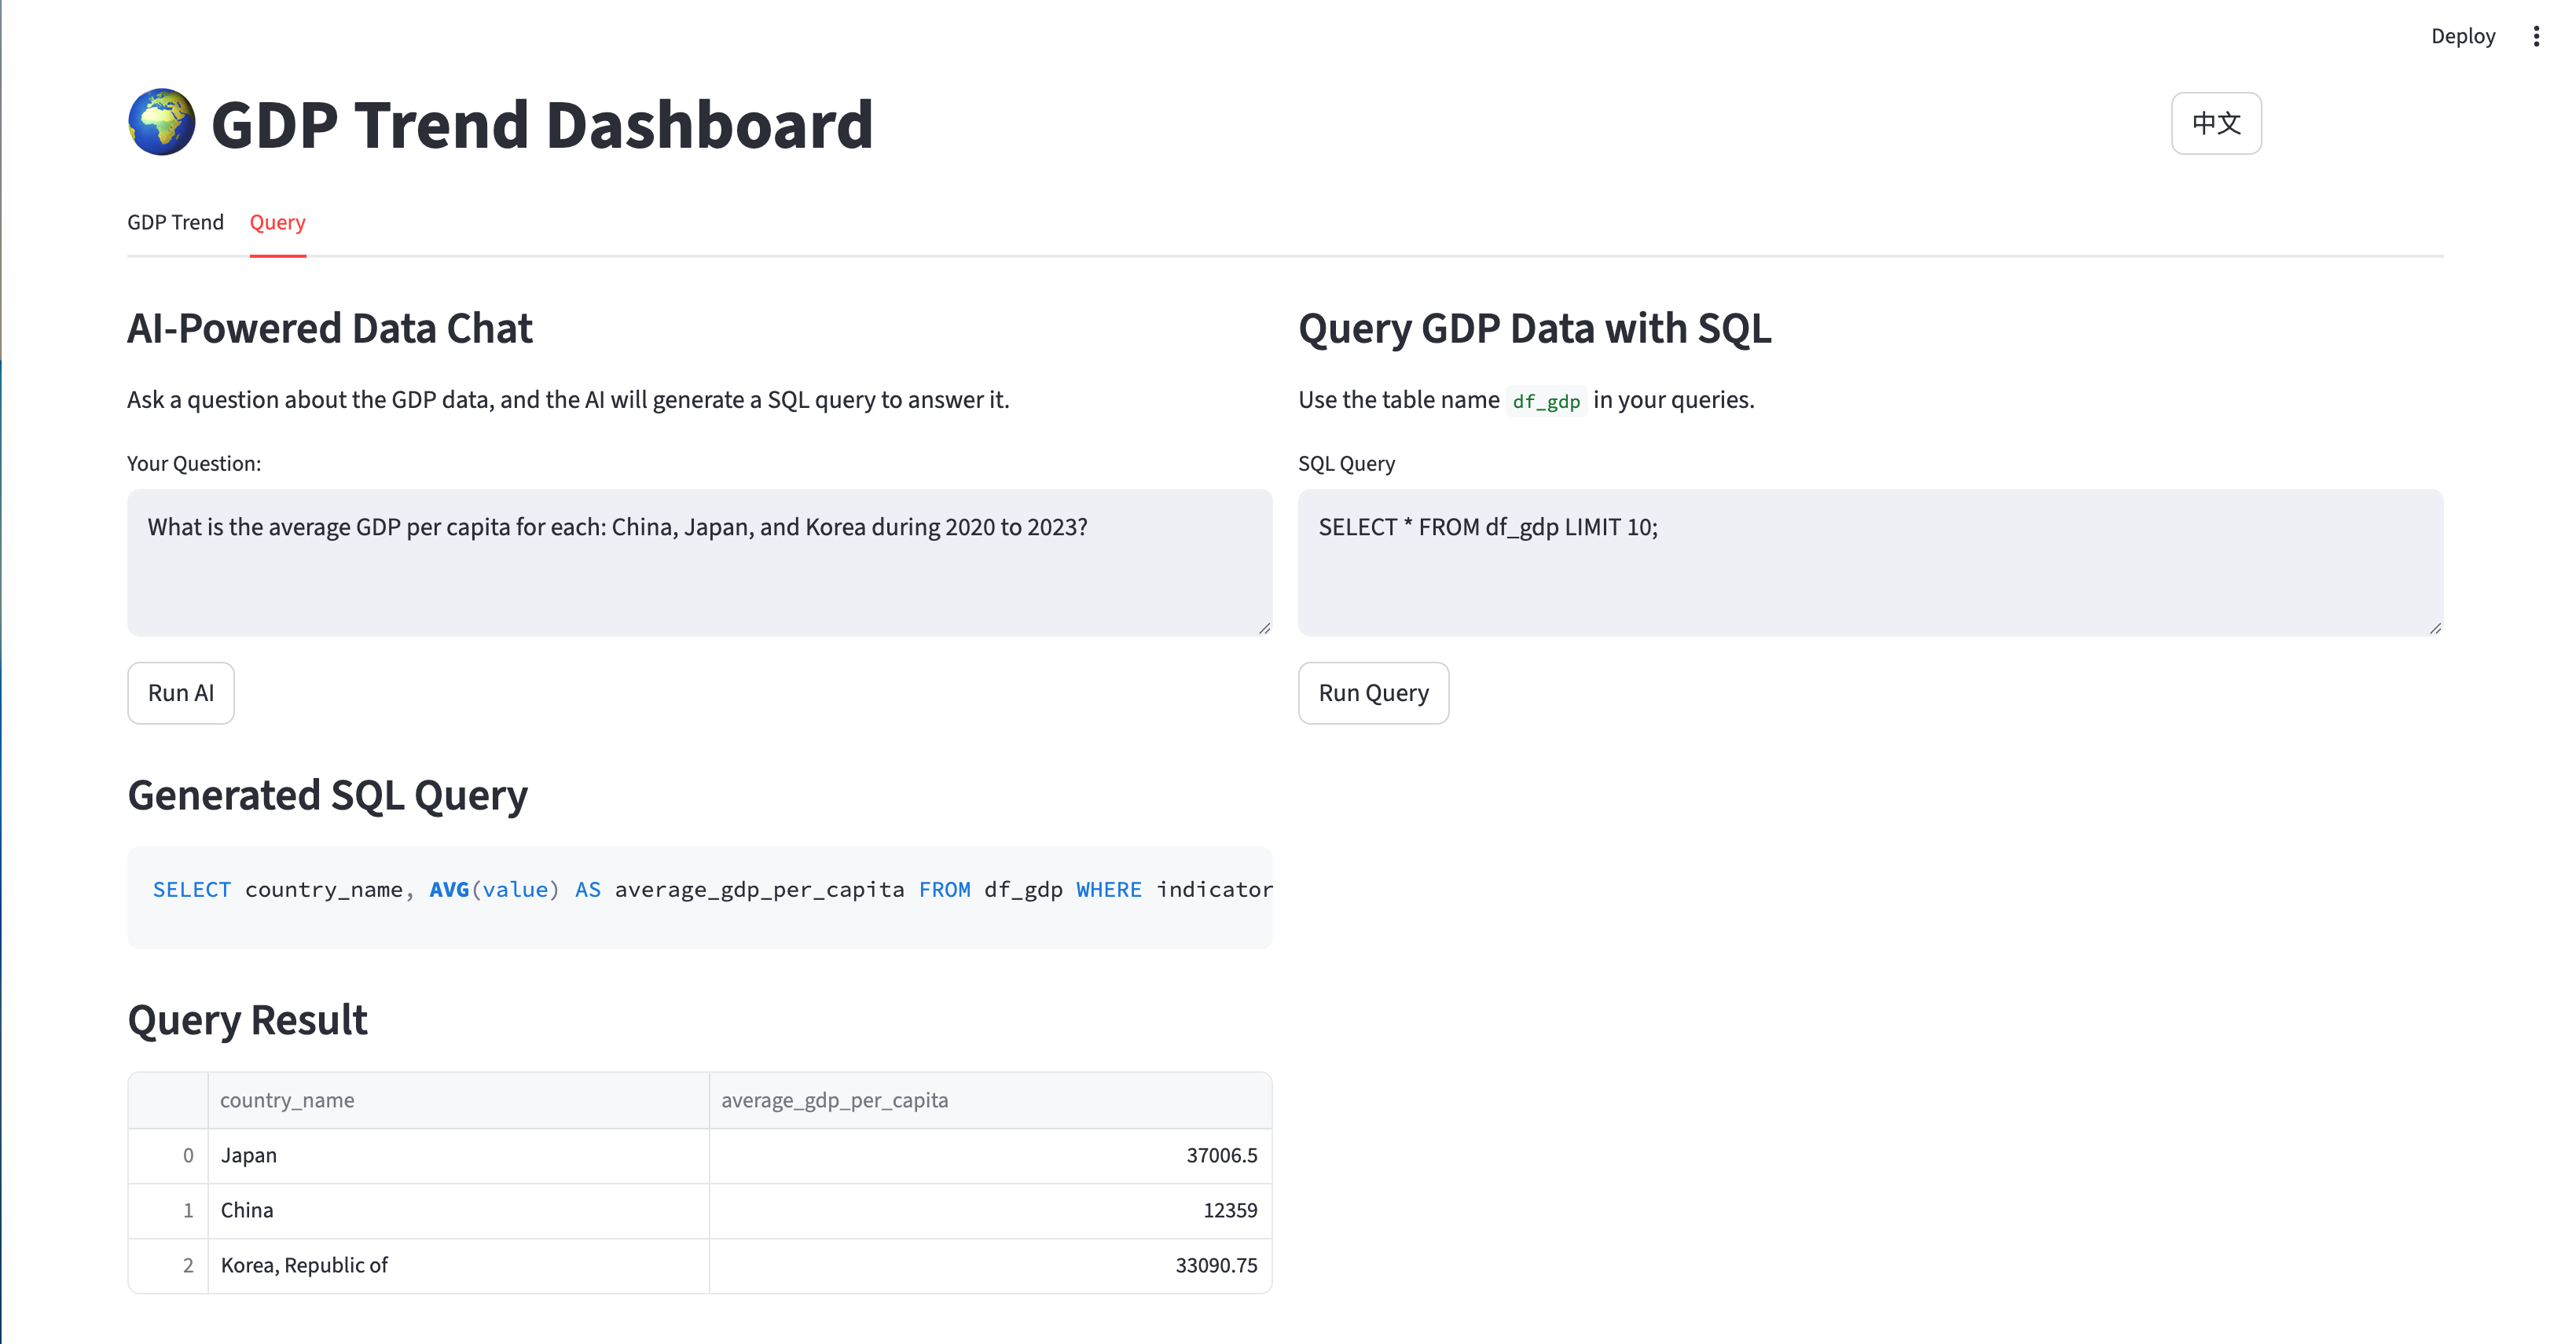
Interactive AI-powered natural language to SQL
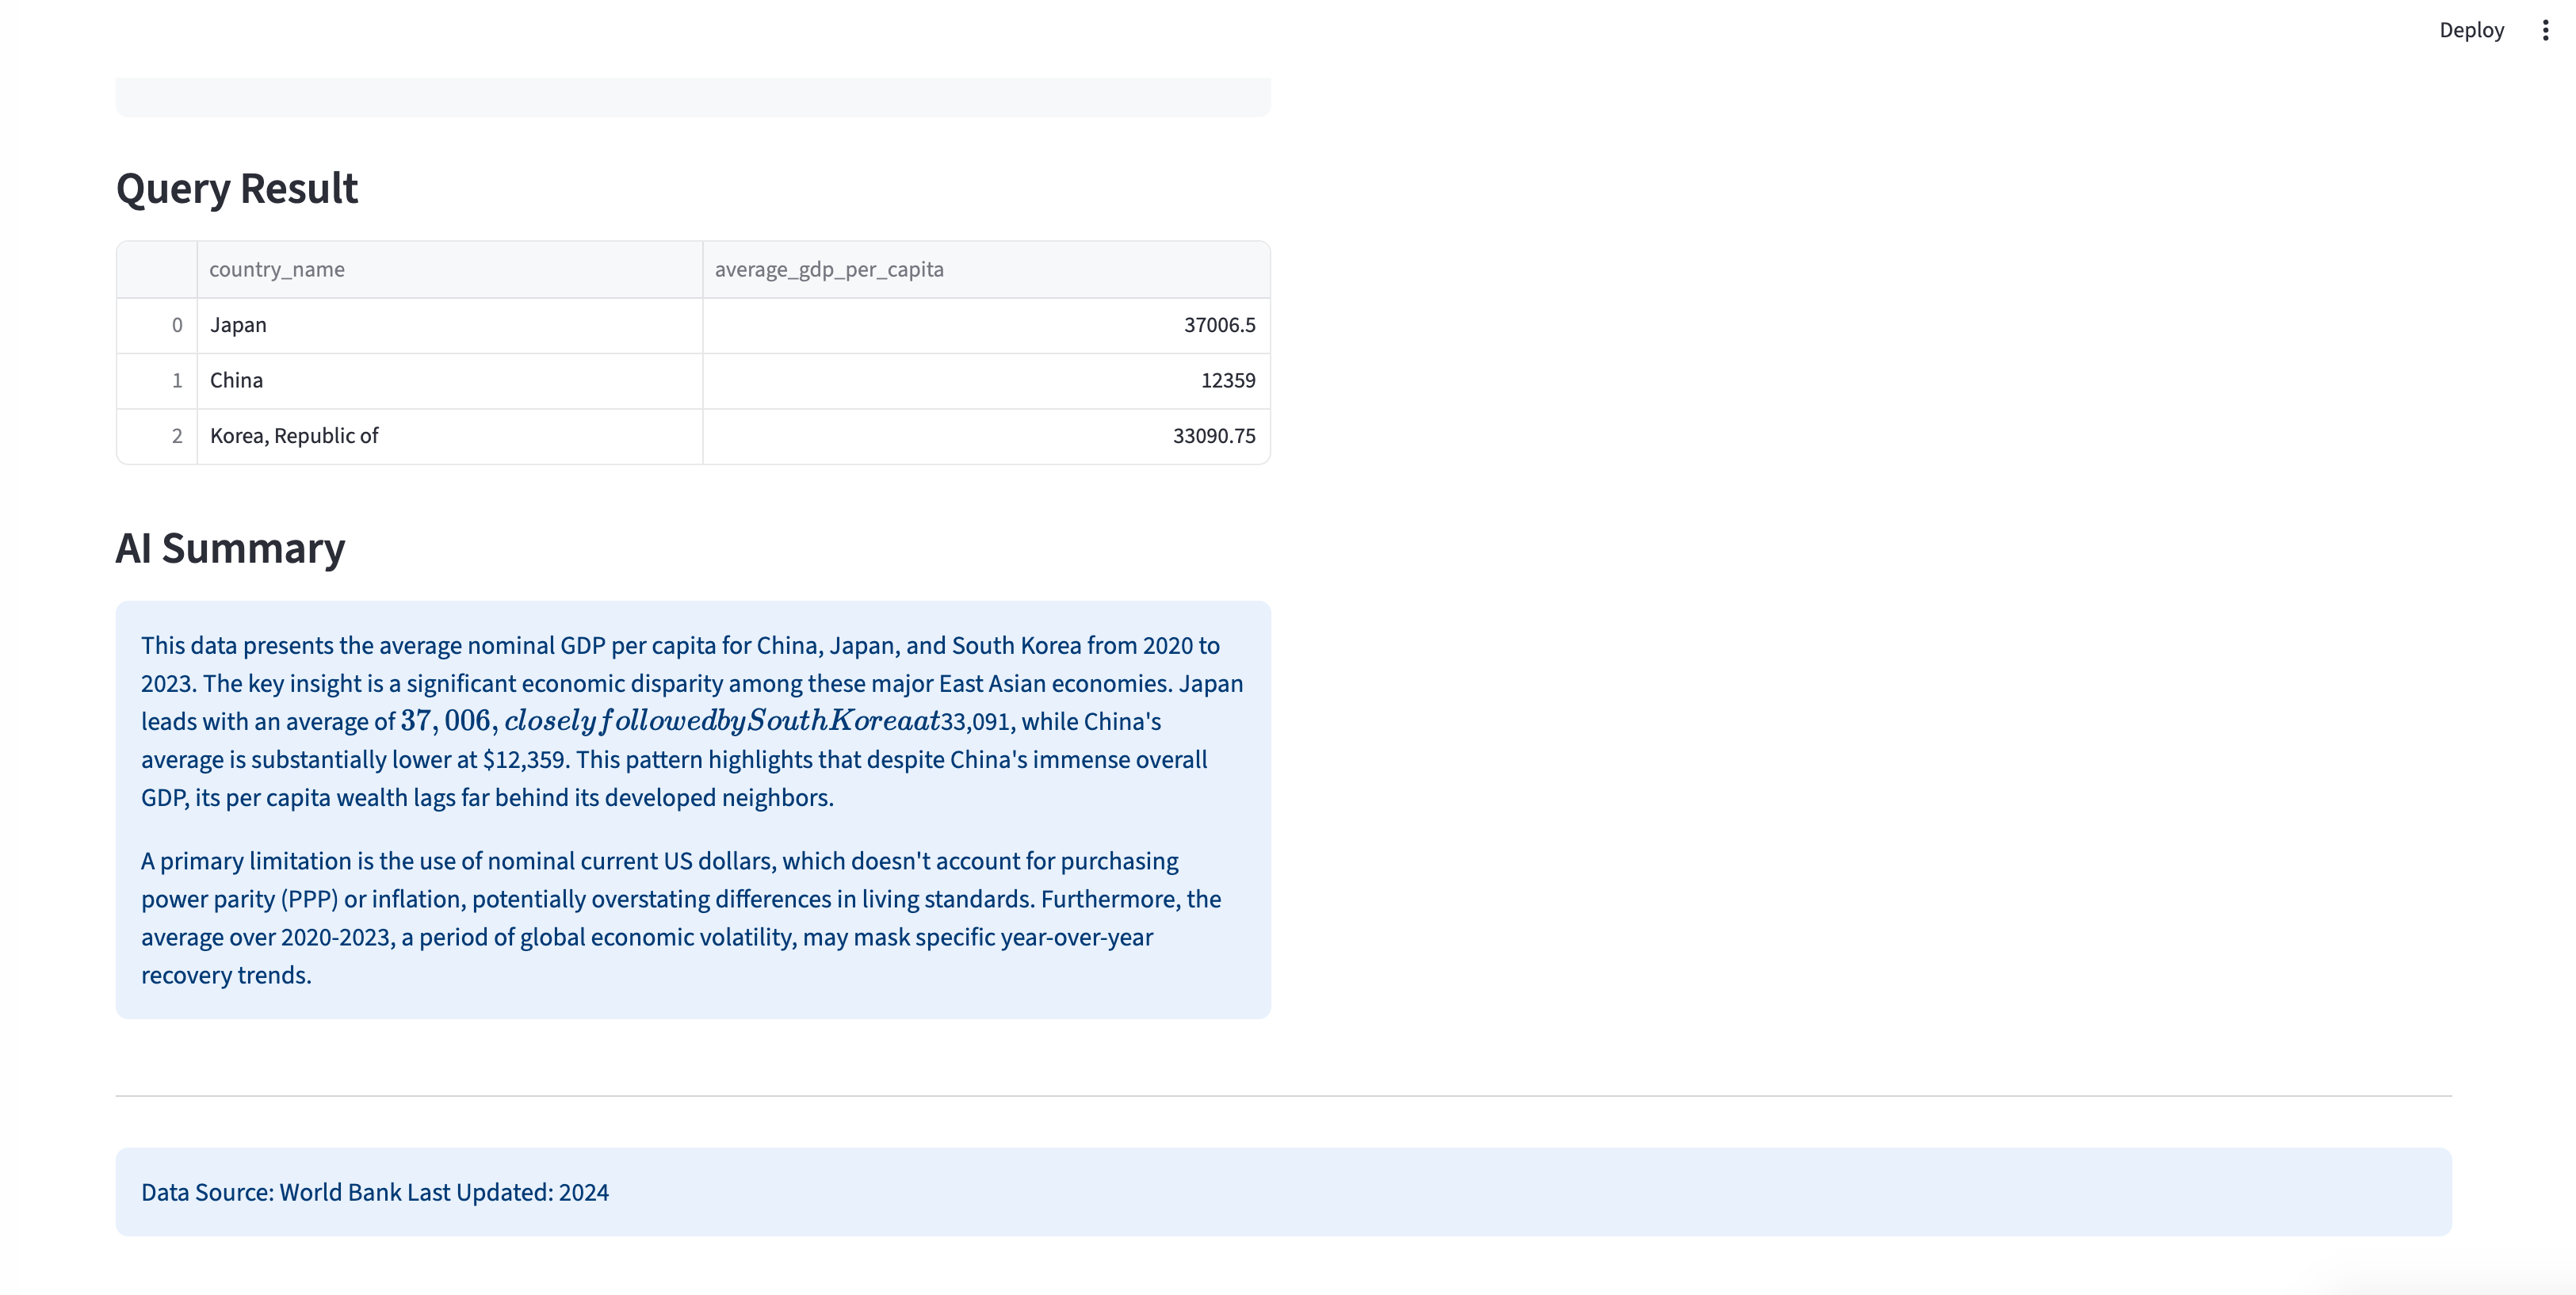
AI-generated summaries of economic data insights
Core Architecture
Technology Stack
- Primary Framework: Streamlit for interactive web applications
- Data Processing: Pandas for manipulation and analysis
- Visualization: Plotly Express for interactive charts
- Database: DuckDB for efficient SQL queries
- AI Integration: ModelScope GLM-4.6 for natural language to SQL conversion
- Data Sources: World Bank API via
wbgapilibrary
Key Features
- Multi-country GDP trend comparisons
- Support for multiple economic indicators (GDP, GDP per capita, population, YoY growth)
- AI-powered natural language querying
- Direct SQL interface with DuckDB
- Complete bilingual support (English/Chinese)
- Time-range filtering with interactive controls (2000-present)
Data Pipeline Architecture
The application implements a sophisticated data pipeline that ensures data quality and real-time availability:
Data Collection and Processing
World Bank API Integration
The application uses the World Bank API to collect comprehensive economic data:
Code
import wbgapi as wb
import pycountry
import pandas as pd

def download_economic_data():
    """Download GDP data from World Bank API for all countries"""

    # Define economic indicators to download
    indicators = {
        'gdp_current_usd': 'NY.GDP.MKTP.CD',
        'gdp_per_capita_current_usd': 'NY.GDP.PCAP.CD',
        'population_total': 'SP.POP.TOTL'
    }

    # Download data from 2000 to present
    data_frames = []
    for indicator_name, indicator_code in indicators.items():
        df = wb.get_series(
            series=indicator_code,
            economy='all',
            time='2000:2024',
            simplify_index=True
        )

        # Process and add to collection
        df = df.reset_index()
        df['indicator'] = indicator_name
        data_frames.append(df)

    # Combine all indicators
    combined_df = pd.concat(data_frames, ignore_index=True)
    return combined_df

def create_country_reference_table():
    """Create comprehensive country metadata with ISO codes"""
    countries = list(pycountry.countries)

    df_all = pd.DataFrame([{
        'country_name': country.name,
        'country_code_2': country.alpha_2,
        'country_code_3': country.alpha_3
    } for country in countries])

    # Add continent mapping
    iso_to_continent = {
        "US": "North America", "CN": "Asia", "JP": "Asia",
        "DE": "Europe", "GB": "Europe", "FR": "Europe"
        # ... complete mapping for all countries
    }

    df_all['continent'] = df_all['country_code_2'].map(iso_to_continent)
    return df_all
Data Schema and Structure
The application uses a clean, normalized data structure:
Code
-- Main data schema
CREATE TABLE df_gdp (
    country_name TEXT,        -- Display name (English)
    country_code_2 TEXT,      -- ISO alpha-2 code
    country_code_3 TEXT,      -- ISO alpha-3 code
    continent TEXT,            -- Continent classification
    year INTEGER,              -- Data year
    indicator TEXT,            -- Economic indicator name
    value REAL                -- Indicator value
);

-- Example data
INSERT INTO df_gdp VALUES
('United States', 'US', 'USA', 'North America', 2023, 'gdp_current_usd', 27444144.3),
('United States', 'US', 'USA', 'North America', 2023, 'gdp_per_capita_current_usd', 81254.2),
('United States', 'US', 'USA', 'North America', 2023, 'population_total', 334914895.0);
Interactive Visualization System
Plotly Express Implementation
The application uses Plotly Express for creating interactive charts with consistent color coding:
Code
import plotly.express as px

@st.cache_data
def load_data():
    """Load and cache GDP data"""
    return pd.read_csv('data/gdp_data_2000_present.csv')

def create_gdp_trend_chart(selected_countries, selected_indicator, year_range):
    """Create interactive GDP trend visualization"""

    # Load filtered data
    df = load_data()

    # Apply filters
    filtered_df = df[
        (df['country_name'].isin(selected_countries)) &
        (df['indicator'] == selected_indicator) &
        (df['year'].between(year_range[0], year_range[1]))
    ]

    # Create interactive line chart
    fig = px.line(
        filtered_df,
        x='year',
        y='value',
        color='country_name',
        title=f'{selected_indicator.replace("_", " ").title()} Trend',
        labels={
            'year': 'Year',
            'value': format_indicator_label(selected_indicator),
            'country_name': 'Country'
        }
    )

    # Customize chart appearance
    fig.update_layout(
        xaxis_title="Year",
        yaxis_title=format_indicator_label(selected_indicator),
        hovermode='x unified',
        showlegend=True,
        legend=dict(
            orientation="h",
            yanchor="bottom",
            y=1.02,
            xanchor="right",
            x=1
        )
    )

    return fig

def format_indicator_label(indicator):
    """Format indicator names for display"""
    labels = {
        'gdp_current_usd': 'GDP (Current USD)',
        'gdp_per_capita_current_usd': 'GDP Per Capita (Current USD)',
        'population_total': 'Total Population',
        'gdp_per_capita_current_usd_yoy': 'GDP Per Capita YoY Growth (%)'
    }
    return labels.get(indicator, indicator.replace('_', ' ').title())
AI-Powered Analytics
Natural Language to SQL Conversion
The application’s most innovative feature is AI-powered natural language querying:
Code
from openai import OpenAI
import duckdb

def generate_sql_from_question(question, language):
    """Convert natural language question to SQL using ModelScope API"""

    # Get database schema for context
    schema_info = """
    Table: df_gdp
    Columns:
    - country_name (TEXT): Country display name
    - country_code_2 (TEXT): ISO alpha-2 country code
    - continent (TEXT): Continent classification
    - year (INTEGER): Data year (2000-2024)
    - indicator (TEXT): Economic indicator name
    - value (REAL): Indicator value

    Available indicators:
    - gdp_current_usd: GDP in current USD
    - gdp_per_capita_current_usd: GDP per capita in current USD
    - population_total: Total population
    - gdp_per_capita_current_usd_yoy: Year-over-year GDP per capita growth (%)
    """

    # Create language-specific prompt
    if language == "zh":
        prompt = f"""请将以下自然语言问题转换为SQL查询,仅返回SQL语句,不要解释。

数据库信息:
{schema_info}

用户问题:{question}

要求:
1. 只返回标准的SELECT语句
2. 不要添加任何解释或注释
3. 使用LIMIT 50限制结果数量"""
    else:
        prompt = f"""Convert the following natural language question to SQL query. Return only the SQL statement, no explanation.

Database information:
{schema_info}

User question: {question}

Requirements:
1. Return only standard SELECT statement
2. Do not add any explanation or comments
3. Use LIMIT 50 to restrict results"""

    # Call ModelScope API
    client = OpenAI(
        api_key=os.getenv('MODELSCOPE_API_KEY'),
        base_url="https://dashscope.aliyuncs.com/compatible-mode/v1"
    )

    response = client.chat.completions.create(
        model="qwen/Qwen3-235B",
        messages=[{"role": "user", "content": prompt}],
        temperature=0.1,  # Low temperature for consistent SQL
        max_tokens=500
    )

    return response.choices[0].message.content.strip()
Query Execution and AI Summarization
Code
def execute_query_with_ai_summary(sql_query, original_question):
    """Execute SQL query and generate AI summary"""

    try:
        # Execute query with DuckDB
        conn = duckdb.connect()
        result_df = conn.execute(sql_query).fetchdf()

        # Store results in session state
        st.session_state.sql_result = result_df
        st.session_state.sql_query = sql_query

        # Generate AI summary if data is available
        if not result_df.empty:
            generate_ai_summary(result_df, original_question)

        return result_df

    except Exception as e:
        st.error(f"Query execution error: {str(e)}")
        return None

def generate_ai_summary(data_frame, question):
    """Generate AI summary of query results"""

    # Convert DataFrame to text for analysis
    data_summary = data_frame.to_string(index=False)

    summary_prompt = f"""Based on the following data analysis results, provide a concise summary:

Original Question: {question}

Query Results:
{data_summary}

Please provide:
1. A brief analysis of the key findings
2. Any notable trends or patterns
3. Important insights from the data

Keep the summary under 200 words and make it easy to understand."""

    # Generate summary using AI
    client = OpenAI(
        api_key=os.getenv('MODELSCOPE_API_KEY'),
        base_url="https://dashscope.aliyuncs.com/compatible-mode/v1"
    )

    response = client.chat.completions.create(
        model="qwen/Qwen3-235B",
        messages=[{"role": "user", "content": summary_prompt}],
        temperature=0.3,
        max_tokens=300
    )

    st.session_state.ai_summary = response.choices[0].message.content
Bilingual Support System
Internationalization Architecture
The application implements comprehensive English/Chinese support:
Code
# language.py - Complete translation system
translations = {
    "en": {
        "title": "🌍 GDP Trend Dashboard",
        "gdp_trend": "GDP Trend",
        "ai_powered_chat": "AI-Powered Data Chat",
        "default_question": "What is the average GDP per capita for China, Japan, and Korea during 2020 to 2023?"
    },
    "zh": {
        "title": "🌍 GDP趋势仪表板",
        "gdp_trend": "GDP趋势",
        "ai_powered_chat": "AI数据对话",
        "default_question": "2020年至2023年期间,中国、日本和韩国的平均人均GDP是多少?"
    }
}

def get_text(key):
    """Get translated text for current language"""
    language = st.session_state.get("language", "en")
    return translations.get(language, {}).get(key, key)

# Language switching in UI
col1, col2 = st.columns([1, 1])
with col1:
    if st.button("English"):
        st.session_state.language = "en"
        st.rerun()
with col2:
    if st.button("中文"):
        st.session_state.language = "zh"
        st.rerun()
User Interface Design
Main Application Structure
Code
def main():
    """Main application with tab-based navigation"""

    # Language toggle in top-right corner
    with st.container():
        st.markdown("""
        <div class="language-toggle">
            <button onclick="setLanguage('en')">EN</button>
            <button onclick="setLanguage('zh')">中文</button>
        </div>
        """, unsafe_allow_html=True)

    st.title(get_text("title"))

    # Tab-based interface
    tab1, tab2 = st.tabs([get_text("gdp_trend"), get_text("query")])

    with tab1:
        render_gdp_trends_tab()

    with tab2:
        render_query_interface_tab()

def render_gdp_trends_tab():
    """Render GDP trends visualization tab"""

    st.header(get_text("gdp_trend"))

    # Load data
    df = load_data()

    # Filter controls
    col1, col2, col3 = st.columns([2, 1, 1])

    with col1:
        selected_countries = st.multiselect(
            get_text("select_countries"),
            options=df['country_name'].unique(),
            default=['United States', 'China', 'Japan']
        )

    with col2:
        selected_indicator = st.selectbox(
            get_text("select_indicator"),
            options=[
                'gdp_current_usd',
                'gdp_per_capita_current_usd',
                'population_total',
                'gdp_per_capita_current_usd_yoy'
            ],
            format_func=lambda x: format_indicator_label(x)
        )

    with col3:
        year_range = st.slider(
            get_text("select_year_range"),
            min_value=2000,
            max_value=2024,
            value=(2010, 2024),
            step=1
        )

    # Generate and display chart
    if selected_countries and selected_indicator:
        fig = create_gdp_trend_chart(selected_countries, selected_indicator, year_range)
        st.plotly_chart(fig, use_container_width=True)

        # Display raw data option
        if st.checkbox(get_text("show_raw_data")):
            display_filtered_data_table(selected_countries, selected_indicator, year_range)

def render_query_interface_tab():
    """Render AI-powered query interface"""

    st.header(get_text("ai_powered_chat"))
    st.markdown(get_text("ai_chat_description"))

    # Natural language input
    user_question = st.text_input(
        get_text("your_question"),
        value=st.session_state.get("user_question", get_text("default_question"))
    )

    col1, col2 = st.columns([1, 1])

    with col1:
        if st.button(get_text("run_ai"), type="primary"):
            if user_question:
                with st.spinner("Processing with AI..."):
                    # Generate SQL from natural language
                    sql_query = generate_sql_from_question(
                        user_question,
                        st.session_state.language
                    )

                    if sql_query:
                        # Execute query and generate summary
                        result_df = execute_query_with_ai_summary(sql_query, user_question)

                        st.session_state.user_question = user_question
                        st.session_state.should_generate_ai_summary = True

    # Display results
    if st.session_state.get("sql_result") is not None:
        display_query_results()
Performance Optimization
Data Caching and Efficiency
Code
# Streamlit caching for data operations
@st.cache_data(ttl=3600)  # Cache for 1 hour
def load_data():
    """Load and cache GDP data"""
    return pd.read_csv('data/gdp_data_2000_present.csv')

@st.cache_data(ttl=1800)  # Cache for 30 minutes
def get_country_list():
    """Get and cache unique country list"""
    df = load_data()
    return sorted(df['country_name'].unique())

# Session state management for AI interactions
def init_session_state():
    """Initialize all session state variables"""
    if "sql_result" not in st.session_state:
        st.session_state.sql_result = None
    if "ai_summary" not in st.session_state:
        st.session_state.ai_summary = None
    if "should_generate_ai_summary" not in st.session_state:
        st.session_state.should_generate_ai_summary = False
Error Handling and User Experience
Code
def safe_api_call(func, *args, **kwargs):
    """Safe API call with error handling"""
    try:
        return func(*args, **kwargs)
    except Exception as e:
        st.error(f"API Error: {str(e)}")
        return None

def validate_sql_query(sql_query):
    """Basic SQL query validation"""
    sql_lower = sql_query.lower().strip()

    # Basic security checks
    dangerous_keywords = ['drop', 'delete', 'update', 'insert', 'alter']
    for keyword in dangerous_keywords:
        if keyword in sql_lower:
            raise ValueError(f"Dangerous SQL keyword detected: {keyword}")

    # Ensure query starts with SELECT
    if not sql_lower.startswith('select'):
        raise ValueError("Only SELECT queries are allowed")

    return True
Deployment and Accessibility
Environment Setup
# Environment configuration
# .env file
MODELSCOPE_API_KEY=your_modelscope_key

# Installation
pip install -r requirements.txt

# Data collection
python download_data.py

# Run application
streamlit run app.py
Requirements and Dependencies
streamlit>=1.28.0
pandas>=1.5.0
plotly>=5.15.0
duckdb>=0.8.0
openai>=1.0.0
python-dotenv>=1.0.0
wbgapi>=1.0.0
pycountry>=22.0.0
numpy>=1.24.0
Technical Achievements
Key Innovations
- Dual Interface Approach: Both visual and natural language access to data
- AI-Powered SQL Generation: Complex economic queries in plain English/Chinese
- Real-time Data Processing: Efficient caching and session management
- Comprehensive Internationalization: True bilingual support with localized data
- Production-Ready Deployment: Robust error handling and performance optimization
Economic Analysis Examples
Supported Query Types
- Comparative Analysis
- “Compare GDP growth between China and Japan from 2010 to 2020”
- “Which countries had the highest GDP per capita in 2023?”
- Time-Series Analysis
- “Show GDP trends for BRIC countries over the last decade”
- “What was the population growth rate for India from 2000 to 2020?”
- Statistical Queries
- “Calculate average GDP growth rate for European countries”
- “Find countries with GDP per capita above $50,000 in 2022”
- Complex Multi-Variable Analysis
- “What is the correlation between population and GDP for Asian countries?”
- “List countries with GDP per capita growth above 5% for 3 consecutive years”
Conclusion
This GDP Trend Dashboard represents an innovative approach to economic data analysis, combining traditional visualization techniques with cutting-edge AI capabilities. The project demonstrates:
- Advanced Data Integration: World Bank API with comprehensive economic indicators
- Natural Language Processing: AI-powered SQL generation for accessible data querying
- Professional Visualization: Interactive Plotly charts with consistent design
- Bilingual Support: Complete English/Chinese localization
- Production-Grade Architecture: Robust error handling, caching, and deployment
Whether you’re an economist, data scientist, or policy analyst, this application showcases how modern AI technologies can make complex economic data more accessible and actionable through intuitive interfaces and intelligent automation.
Technology Stack: Streamlit, DuckDB, Plotly, ModelScope API, World Bank API
Data Source: World Bank (2000-2024, 200+ countries, 15K+ data points)